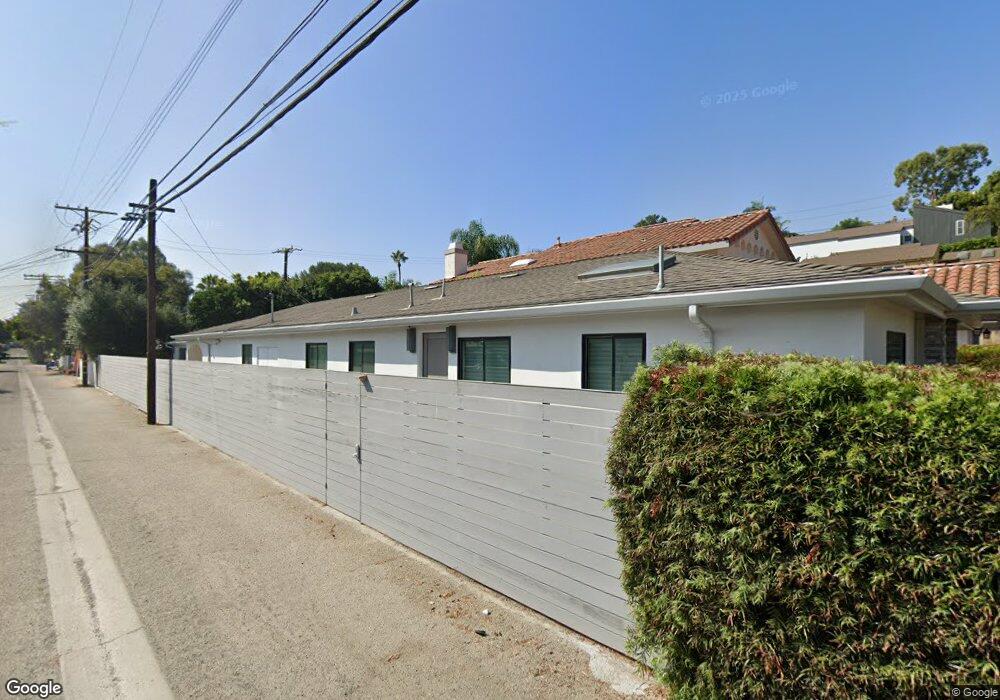
438 Talbert St Playa Del Rey, CA 90293
Estimated Value: $1,763,000 - $1,977,000
3
Beds
3
Baths
1,804
Sq Ft
$1,016/Sq Ft
Est. Value
About This Home
This home is located at 438 Talbert St, Playa Del Rey, CA 90293 and is currently estimated at $1,832,833, approximately $1,015 per square foot. 438 Talbert St is a home located in Los Angeles County with nearby schools including Paseo Del Rey Natural Science Magnet, Loyola Village Elementary School, and Kentwood Elementary.
Ownership History
Date
Name
Owned For
Owner Type
Purchase Details
Closed on
May 20, 2019
Sold by
Culka Astrid
Bought by
Culka Astrid and Astrid Culka Declaration Of Tr
Current Estimated Value
Purchase Details
Closed on
Mar 15, 2018
Sold by
Roh Jerry L and The Leonard James Roh Revocabl
Bought by
Culka Astrid
Purchase Details
Closed on
Aug 10, 2000
Sold by
Roh Leonard J
Bought by
Roh L James and Leonard James Roh Revocable Tr
Create a Home Valuation Report for This Property
The Home Valuation Report is an in-depth analysis detailing your home's value as well as a comparison with similar homes in the area
Home Values in the Area
Average Home Value in this Area
Purchase History
We collect this data history from publicly available records. To have your information removed, we recommend requesting removal directly through your county’s website.
| Date | Buyer | Sale Price | Title Company |
|---|---|---|---|
| Culka Astrid | -- | None Available | |
| Culka Astrid | $1,200,000 | Guardian Title Company | |
| Roh L James | -- | -- |
Source: Public Records
Tax History
| Year | Tax Paid | Tax Assessment Tax Assessment Total Assessment is a certain percentage of the fair market value that is determined by local assessors to be the total taxable value of land and additions on the property. | Land | Improvement |
|---|---|---|---|---|
| 2025 | $18,441 | $1,548,028 | $1,092,313 | $455,715 |
| 2024 | $18,441 | $1,517,676 | $1,070,896 | $446,780 |
| 2023 | $18,084 | $1,487,919 | $1,049,899 | $438,020 |
| 2022 | $17,238 | $1,458,745 | $1,029,313 | $429,432 |
| 2021 | $17,027 | $1,430,143 | $1,009,131 | $421,012 |
| 2019 | $14,557 | $1,224,000 | $979,200 | $244,800 |
| 2018 | $1,806 | $145,193 | $73,487 | $71,706 |
| 2016 | $1,714 | $139,557 | $70,635 | $68,922 |
| 2015 | $1,689 | $137,461 | $69,574 | $67,887 |
| 2014 | $1,705 | $134,770 | $68,212 | $66,558 |
Source: Public Records
Map
Nearby Homes
- 7406 Earldom Ave
- 7313 S Earldom Ave
- 8324 W Manchester Ave
- 8701 Delgany Ave Unit 110
- 8701 Delgany Ave Unit 205
- 8358 Manitoba St Unit 8
- 8346 Manitoba St Unit 11
- 8238 W Manchester Ave Unit 308
- 8238 W Manchester Ave Unit 103
- 8710 Delgany Ave Unit 3
- 8710 Delgany Ave Unit 8
- 8738 Delgany Ave Unit 107
- 8236 Delgany Ave
- 7325 Rindge Ave
- 8740 Tuscany Ave Unit 211
- 8163 Redlands St Unit 73
- 231 Sunridge St
- 8512 Tuscany Ave Unit 207
- 8512 Tuscany Ave Unit 222
- 8222 Pershing Dr
- 434 Talbert St
- 430 Talbert St
- 8607 Pershing Dr
- 8601 Pershing Dr
- 8611 Pershing Dr
- 426 Talbert St
- 8617 Pershing Dr
- 439 Redlands St
- 435 Redlands St
- 422 Talbert St
- 8621 Pershing Dr
- 431 Redlands St
- 427 Redlands St
- 8527 Pershing Dr
- 439 Talbert St
- 8625- 8629 Pershing Dr
- 8625 Pershing Dr
- 435 Talbert St
- 423 Redlands St
- 431 Talbert St
Your Personal Tour Guide
Ask me questions while you tour the home.