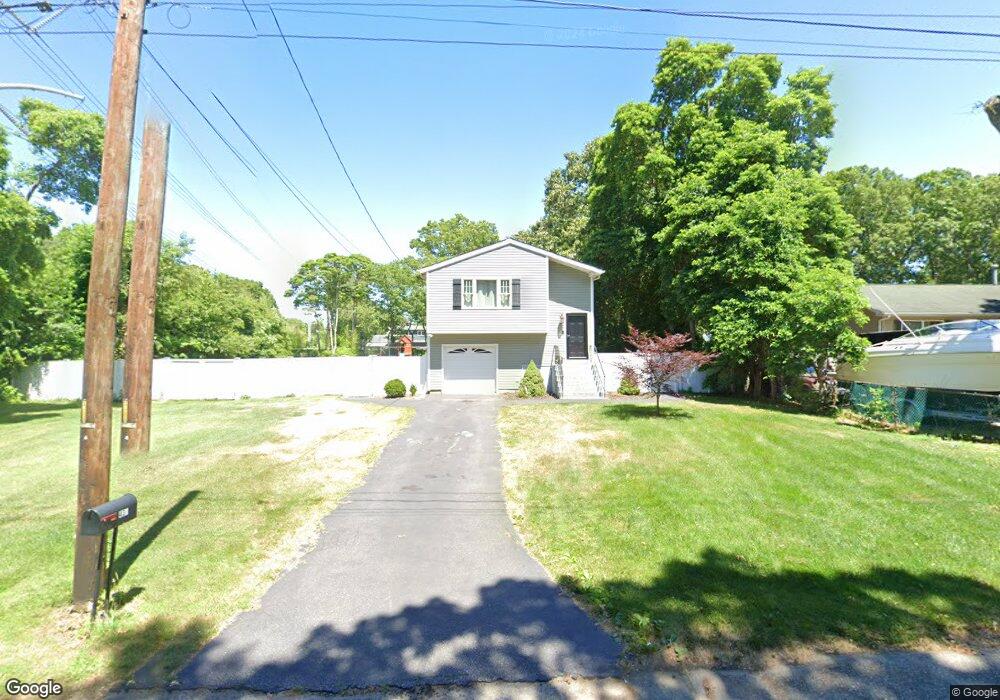
438 W End Ave Shirley, NY 11967
Estimated Value: $524,132 - $672,000
4
Beds
2
Baths
1,828
Sq Ft
$326/Sq Ft
Est. Value
About This Home
This home is located at 438 W End Ave, Shirley, NY 11967 and is currently estimated at $596,533, approximately $326 per square foot. 438 W End Ave is a home located in Suffolk County with nearby schools including Longwood Junior High School, Longwood Middle School, and Longwood Senior High School.
Ownership History
Date
Name
Owned For
Owner Type
Purchase Details
Closed on
Dec 13, 2016
Sold by
Dj Custom Homes Corp
Bought by
Fasulo Vincent
Current Estimated Value
Home Financials for this Owner
Home Financials are based on the most recent Mortgage that was taken out on this home.
Original Mortgage
$223,900
Outstanding Balance
$183,100
Interest Rate
3.94%
Mortgage Type
New Conventional
Estimated Equity
$413,433
Purchase Details
Closed on
Nov 20, 2015
Sold by
U S Bank Trust N A
Bought by
Dj Custom Homes Corp
Purchase Details
Closed on
Oct 16, 2015
Sold by
Referee Of Suffolk County and Moncayo
Bought by
U S Bank Trust N A
Purchase Details
Closed on
Apr 29, 2002
Sold by
Lombardo Rosario Sal and Lombardo Joan F
Bought by
Cruz Virginia
Home Financials for this Owner
Home Financials are based on the most recent Mortgage that was taken out on this home.
Original Mortgage
$147,450
Interest Rate
7.18%
Mortgage Type
FHA
Create a Home Valuation Report for This Property
The Home Valuation Report is an in-depth analysis detailing your home's value as well as a comparison with similar homes in the area
Home Values in the Area
Average Home Value in this Area
Purchase History
| Date | Buyer | Sale Price | Title Company |
|---|---|---|---|
| Fasulo Vincent | $279,900 | Omni Title Agency | |
| Fasulo Vincent | $279,900 | Omni Title Agency | |
| Dj Custom Homes Corp | $117,750 | None Available | |
| Dj Custom Homes Corp | $117,750 | None Available | |
| U S Bank Trust N A | $265,810 | None Available | |
| U S Bank Trust N A | $265,810 | None Available | |
| Cruz Virginia | $153,000 | Titlewaves Title Agency | |
| Cruz Virginia | $153,000 | Titlewaves Title Agency |
Source: Public Records
Mortgage History
| Date | Status | Borrower | Loan Amount |
|---|---|---|---|
| Open | Fasulo Vincent | $223,900 | |
| Closed | Fasulo Vincent | $223,900 | |
| Previous Owner | Cruz Virginia | $147,450 | |
| Closed | U S Bank Trust N A | $0 |
Source: Public Records
Tax History Compared to Growth
Tax History
| Year | Tax Paid | Tax Assessment Tax Assessment Total Assessment is a certain percentage of the fair market value that is determined by local assessors to be the total taxable value of land and additions on the property. | Land | Improvement |
|---|---|---|---|---|
| 2024 | $11,217 | $2,445 | $200 | $2,245 |
| 2023 | $11,217 | $2,445 | $200 | $2,245 |
| 2022 | $10,388 | $2,445 | $200 | $2,245 |
| 2021 | $10,388 | $2,445 | $200 | $2,245 |
| 2020 | $10,597 | $2,445 | $200 | $2,245 |
| 2019 | $10,597 | $0 | $0 | $0 |
| 2018 | $10,120 | $2,445 | $200 | $2,245 |
| 2017 | $10,120 | $2,445 | $200 | $2,245 |
| 2016 | $9,989 | $2,445 | $200 | $2,245 |
| 2015 | -- | $2,445 | $200 | $2,245 |
| 2014 | -- | $2,445 | $200 | $2,245 |
Source: Public Records
Map
Nearby Homes
- 68 Crestwood Dr
- 34 Belmont Dr
- 23 Monty Dr Unit 14
- 411 Glen Dr
- VL Glen Dr
- 65 Colin Dr
- 283 W End Ave
- 8 & 11 William Floyd Pkwy
- 1330 William Floyd Pkwy
- 334 Carnation Dr
- 380 Wellwood Dr
- 336 Auborn Ave
- 459 Wellwood Dr
- 476 Carnation Dr
- 101 Crestwood Dr
- 461 Avondale Dr
- 313 Decatur Ave
- 84 Ridgewood Dr
- 88 Ridgewood Dr
- 1276 William Floyd Pkwy