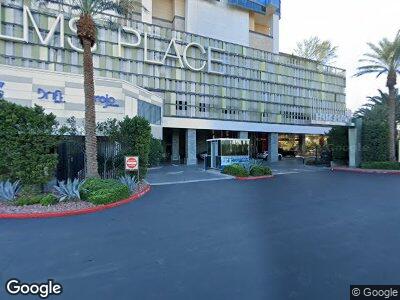
4381 W Flamingo Rd Unit 2607 Las Vegas, NV 89103
West of the Strip NeighborhoodEstimated Value: $285,371 - $379,000
1
Bed
1
Bath
615
Sq Ft
$517/Sq Ft
Est. Value
About This Home
This home is located at 4381 W Flamingo Rd Unit 2607, Las Vegas, NV 89103 and is currently estimated at $318,093, approximately $517 per square foot. 4381 W Flamingo Rd Unit 2607 is a home located in Clark County with nearby schools including Joseph E Thiriot Elementary School, Grant Sawyer Middle School, and Ed W Clark High School.
Ownership History
Date
Name
Owned For
Owner Type
Purchase Details
Closed on
Apr 25, 2019
Sold by
Palermo Joseph James
Bought by
Dabe Sherif E El
Current Estimated Value
Purchase Details
Closed on
Apr 28, 2008
Sold by
El Dabe Sherif E
Bought by
El Dabe Sherif E and Palermo Joseph James
Home Financials for this Owner
Home Financials are based on the most recent Mortgage that was taken out on this home.
Original Mortgage
$405,168
Interest Rate
6.25%
Mortgage Type
Purchase Money Mortgage
Purchase Details
Closed on
Mar 12, 2008
Sold by
Palms Place Llc
Bought by
El Dabe Sherif E
Home Financials for this Owner
Home Financials are based on the most recent Mortgage that was taken out on this home.
Original Mortgage
$405,168
Interest Rate
6.25%
Mortgage Type
Purchase Money Mortgage
Create a Home Valuation Report for This Property
The Home Valuation Report is an in-depth analysis detailing your home's value as well as a comparison with similar homes in the area
Home Values in the Area
Average Home Value in this Area
Purchase History
| Date | Buyer | Sale Price | Title Company |
|---|---|---|---|
| Dabe Sherif E El | -- | None Available | |
| El Dabe Sherif E | $540,225 | None Available | |
| El Dabe Sherif E | $540,225 | Stewart Title Of Nevada |
Source: Public Records
Mortgage History
| Date | Status | Borrower | Loan Amount |
|---|---|---|---|
| Previous Owner | El Dabe Sherif E | $405,168 |
Source: Public Records
Tax History Compared to Growth
Tax History
| Year | Tax Paid | Tax Assessment Tax Assessment Total Assessment is a certain percentage of the fair market value that is determined by local assessors to be the total taxable value of land and additions on the property. | Land | Improvement |
|---|---|---|---|---|
| 2025 | $2,312 | $91,879 | $36,330 | $55,549 |
| 2024 | $2,031 | $91,879 | $36,330 | $55,549 |
| 2023 | $1,426 | $86,451 | $36,330 | $50,121 |
| 2022 | $1,822 | $77,597 | $32,025 | $45,572 |
| 2021 | $1,684 | $74,700 | $29,873 | $44,827 |
| 2020 | $1,702 | $75,020 | $29,873 | $45,147 |
| 2019 | $1,595 | $73,189 | $29,873 | $43,316 |
| 2018 | $1,522 | $63,438 | $20,318 | $43,120 |
| 2017 | $1,883 | $64,190 | $20,318 | $43,872 |
| 2016 | $1,426 | $59,751 | $17,500 | $42,251 |
| 2015 | $1,422 | $55,653 | $17,500 | $38,153 |
| 2014 | $1,380 | $45,666 | $17,500 | $28,166 |
Source: Public Records
Map
Nearby Homes
- 4381 W Flamingo Rd Unit 5220
- 4381 W Flamingo Rd Unit 1512
- 4381 W Flamingo Rd Unit 8304
- 4381 W Flamingo Rd Unit 1905
- 4381 W Flamingo Rd Unit 2010
- 4381 W Flamingo Rd Unit 2902
- 4381 W Flamingo Rd Unit 3221
- 4381 W Flamingo Rd Unit 3002
- 4381 W Flamingo Rd Unit 5103
- 4381 W Flamingo Rd Unit 2220
- 4381 W Flamingo Rd Unit 901
- 4381 W Flamingo Rd Unit 2612
- 4381 W Flamingo Rd Unit 2022
- 4381 W Flamingo Rd Unit 1206
- 4381 W Flamingo Rd Unit 1121
- 4381 W Flamingo Rd Unit 1508
- 4381 W Flamingo Rd Unit 3809
- 4381 W Flamingo Rd Unit 18320
- 4381 W Flamingo Rd Unit 1101
- 4381 W Flamingo Rd Unit 3616
- 4381 W Flamingo Rd Unit 5806
- 4381 W Flamingo Rd Unit 922
- 4381 W Flamingo Rd
- 4381 W Flamingo Rd Unit 1520&1522
- 4381 W Flamingo Rd Unit 2716
- 4381 W Flamingo Rd Unit 3305
- 4381 W Flamingo Rd Unit 53318
- 4381 W Flamingo Rd Unit none
- 4381 W Flamingo Rd Unit 51318
- 4381 W Flamingo Rd Unit 5122/5120
- 4381 W Flamingo Rd Unit 58308
- 4381 W Flamingo Rd Unit 33306
- 4381 W Flamingo Rd Unit 9303
- 4381 W Flamingo Rd Unit 34301
- 4381 W Flamingo Rd Unit 17322
- 4381 W Flamingo Rd Unit 15319
- 4381 W Flamingo Rd Unit 3409
- 4381 W Flamingo Rd Unit 2607
- 4381 W Flamingo Rd Unit 1204