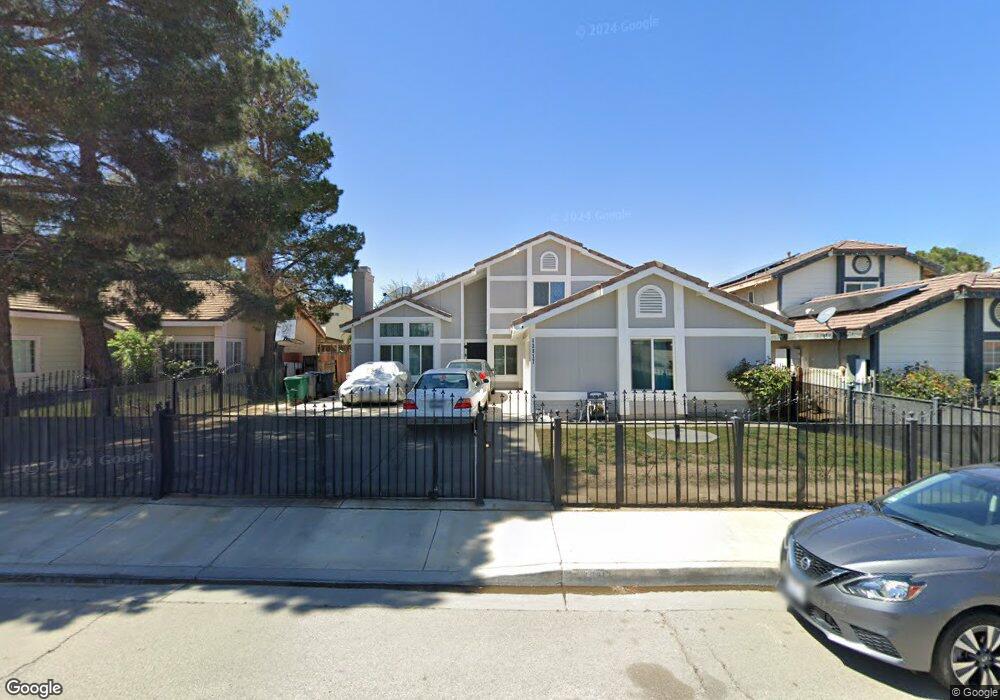
43817 27th St E Lancaster, CA 93535
East Lancaster NeighborhoodEstimated Value: $463,496 - $493,000
4
Beds
3
Baths
1,825
Sq Ft
$263/Sq Ft
Est. Value
About This Home
This home is located at 43817 27th St E, Lancaster, CA 93535 and is currently estimated at $480,374, approximately $263 per square foot. 43817 27th St E is a home located in Los Angeles County with nearby schools including Columbia Elementary School, Gifford C. Cole Middle School, and Eastside High School.
Ownership History
Date
Name
Owned For
Owner Type
Purchase Details
Closed on
Oct 10, 2002
Sold by
Wilbert Ronald R
Bought by
Williams Michelle
Current Estimated Value
Home Financials for this Owner
Home Financials are based on the most recent Mortgage that was taken out on this home.
Original Mortgage
$126,400
Interest Rate
7.5%
Purchase Details
Closed on
Aug 28, 2002
Sold by
Campbell David Glenn and Campbell Leticia
Bought by
Williams Michelle
Home Financials for this Owner
Home Financials are based on the most recent Mortgage that was taken out on this home.
Original Mortgage
$126,400
Interest Rate
7.5%
Purchase Details
Closed on
Aug 12, 2002
Sold by
Campbell Arvell Clifton and Campbell Velma Lee
Bought by
Campbell David Glenn
Home Financials for this Owner
Home Financials are based on the most recent Mortgage that was taken out on this home.
Original Mortgage
$126,400
Interest Rate
7.5%
Purchase Details
Closed on
Oct 15, 1993
Sold by
Campbell Arvell Clifton and Campbell Velma Lee
Bought by
Campbell Arvell Clifton
Create a Home Valuation Report for This Property
The Home Valuation Report is an in-depth analysis detailing your home's value as well as a comparison with similar homes in the area
Home Values in the Area
Average Home Value in this Area
Purchase History
| Date | Buyer | Sale Price | Title Company |
|---|---|---|---|
| Williams Michelle | -- | First American Title Co | |
| Williams Michelle | $158,000 | First American Title Co | |
| Campbell David Glenn | -- | -- | |
| Campbell Arvell Clifton | -- | -- |
Source: Public Records
Mortgage History
| Date | Status | Borrower | Loan Amount |
|---|---|---|---|
| Previous Owner | Williams Michelle | $126,400 | |
| Closed | Williams Michelle | $31,800 |
Source: Public Records
Tax History
| Year | Tax Paid | Tax Assessment Tax Assessment Total Assessment is a certain percentage of the fair market value that is determined by local assessors to be the total taxable value of land and additions on the property. | Land | Improvement |
|---|---|---|---|---|
| 2025 | $4,033 | $228,808 | $45,753 | $183,055 |
| 2024 | $4,033 | $224,322 | $44,856 | $179,466 |
| 2023 | $3,911 | $219,925 | $43,977 | $175,948 |
| 2022 | $3,777 | $215,614 | $43,115 | $172,499 |
| 2021 | $3,418 | $211,387 | $42,270 | $169,117 |
| 2019 | $3,348 | $205,118 | $41,017 | $164,101 |
| 2018 | $3,292 | $201,097 | $40,213 | $160,884 |
| 2016 | $3,132 | $193,290 | $38,652 | $154,638 |
| 2015 | $3,048 | $187,000 | $37,400 | $149,600 |
| 2014 | $2,720 | $156,000 | $31,200 | $124,800 |
Source: Public Records
Map
Nearby Homes
- 43752 Tranquility Ct
- 43846 Tranquility Ct
- 43823 Tranquility Ct
- 43716 La Paz Ln
- 43824 Serenity Ct
- 43938 Delgado Ct
- 43749 San Francisco Ave
- 43653 Serenity Ct
- 43730 San Francisco Ave
- 43846 Estrella Ln
- 2852 San Ramon Dr
- 2330 E Avenue J 8 Unit 92
- 2330 E Avenue J 8 Unit 192
- 110 E Avenue J 8
- 100 E Avenue J 8
- 3042 San Luis Dr
- 2203 Rosewood Ave
- 43659 Ponderosa St
- 44105 Acacia St
- 44135 Camellia St
- 43823 27th St E
- 43811 27th St E
- 43808 Easy St
- 43829 27th St E
- 43803 27th St E
- 43814 Easy St
- 43804 Easy St
- 43816 27th St E
- 43822 Easy St
- 43835 27th St E
- 43763 27th St E
- 43828 27th St E
- 43808 27th St E
- 43832 27th St E
- 43801 Easy St
- 2647 Harmony Way
- 43802 27th St E
- 43841 27th St E
- 43757 27th St E
- 43826 Easy St
Your Personal Tour Guide
Ask me questions while you tour the home.