
Seller's Agent in 2018
Amelia Jeffers
Keller Williams Capital Ptnrs
(740) 815-7016
13 Total Sales


Estimated Value: $1,060,536 - $1,170,000
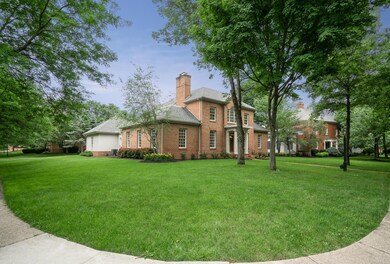
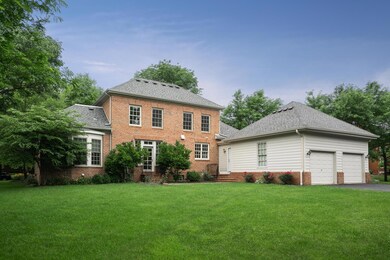
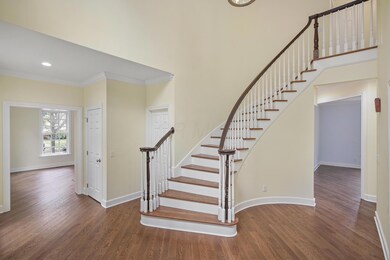
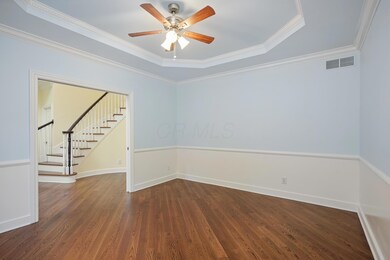
Recent upgrades include roof & hvac 2012, exterior paint, 2015 new hardwood floors, majority new paint and many fixtures kitchen with granite counters, new backsplash and SS appliances, 12 new windows, new hardware and rec room carpet. This central Fenway brick home is located two lots south of the Upper Fenway Park and approximately 8 lots off of Central Fenway Park. Beautiful lot! First floor master suite, great kitchen open to great room and den. 3 BRs 2BA upstairs plus finished lower level with full bath. Two car rear loaded garage with lot that will likely allow for additional garage to be built. Hard to find this size, quality and location for this price! Leisure trails to NACC, three close parks and market and main/market square area. Owner is licensed agent in the State of Ohio
Last Agent to Sell the Property
Keller Williams Capital Ptnrs License #2008000976 Listed on: 06/27/2018
Last Buyer's Agent
Anthony Thomas
New Albany Realty, LTD
| Date | Buyer | Sale Price | Title Company |
|---|---|---|---|
| Snyder Cynthia R | $612,500 | Stewart Title | |
| Fisher John J | $500,000 | World Class Title Agency Of | |
| Milenkovich John | -- | Attorney | |
| Milenkovich John | -- | None Available | |
| Milenkovich James | -- | -- | |
| Milenkovich James | $113,600 | Lll Title |
| Date | Status | Borrower | Loan Amount |
|---|---|---|---|
| Previous Owner | Fisher John J | $49,900 | |
| Previous Owner | Milenkovich James | $335,000 |
| Date | Event | Price | List to Sale | Price per Sq Ft | Prior Sale |
|---|---|---|---|---|---|
| 03/27/2025 03/27/25 | Off Market | $500,000 | -- | -- | |
| 10/26/2018 10/26/18 | Sold | $612,500 | -5.6% | $136 / Sq Ft | |
| 09/26/2018 09/26/18 | Pending | -- | -- | -- | |
| 06/27/2018 06/27/18 | For Sale | $649,000 | +29.8% | $144 / Sq Ft | |
| 02/16/2016 02/16/16 | Sold | $500,000 | -23.7% | $111 / Sq Ft | View Prior Sale |
| 01/17/2016 01/17/16 | Pending | -- | -- | -- | |
| 07/10/2015 07/10/15 | For Sale | $655,000 | -- | $145 / Sq Ft |
| Year | Tax Paid | Tax Assessment Tax Assessment Total Assessment is a certain percentage of the fair market value that is determined by local assessors to be the total taxable value of land and additions on the property. | Land | Improvement |
|---|---|---|---|---|
| 2024 | $15,229 | $244,790 | $77,000 | $167,790 |
| 2023 | $14,399 | $244,790 | $77,000 | $167,790 |
| 2022 | $13,817 | $178,540 | $55,130 | $123,410 |
| 2021 | $13,297 | $178,540 | $55,130 | $123,410 |
| 2020 | $13,283 | $178,540 | $55,130 | $123,410 |
| 2019 | $13,835 | $170,070 | $52,500 | $117,570 |
| 2018 | $15,877 | $170,070 | $52,500 | $117,570 |
| 2017 | $14,684 | $170,070 | $52,500 | $117,570 |
| 2016 | $15,447 | $175,010 | $52,610 | $122,400 |
| 2015 | $18,083 | $204,480 | $52,610 | $151,870 |
| 2014 | $16,953 | $204,480 | $52,610 | $151,870 |
| 2013 | $8,723 | $194,705 | $50,085 | $144,620 |
Seller's Agent in 2018
Amelia Jeffers
Keller Williams Capital Ptnrs
(740) 815-7016
13 Total Sales
A
Buyer's Agent in 2018
Anthony Thomas
New Albany Realty, LTD
Seller's Agent in 2016
Mark Neff
New Albany Realty, LTD
(614) 939-8929
261 Total Sales
Source: Columbus and Central Ohio Regional MLS
MLS Number: 218023308
APN: 222-001394
Disclaimer: Certain information contained herein is derived from information provided by parties other than Homes.com. All information provided is deemed reliable, but is not guaranteed to be accurate and should be independently verified.
![]() IDX information is provided exclusively for personal, non-commercial use, and may not be used for any purpose other than to identify prospective properties consumers may be interested in purchasing.
IDX information is provided exclusively for personal, non-commercial use, and may not be used for any purpose other than to identify prospective properties consumers may be interested in purchasing.
Information is deemed reliable but not guaranteed.