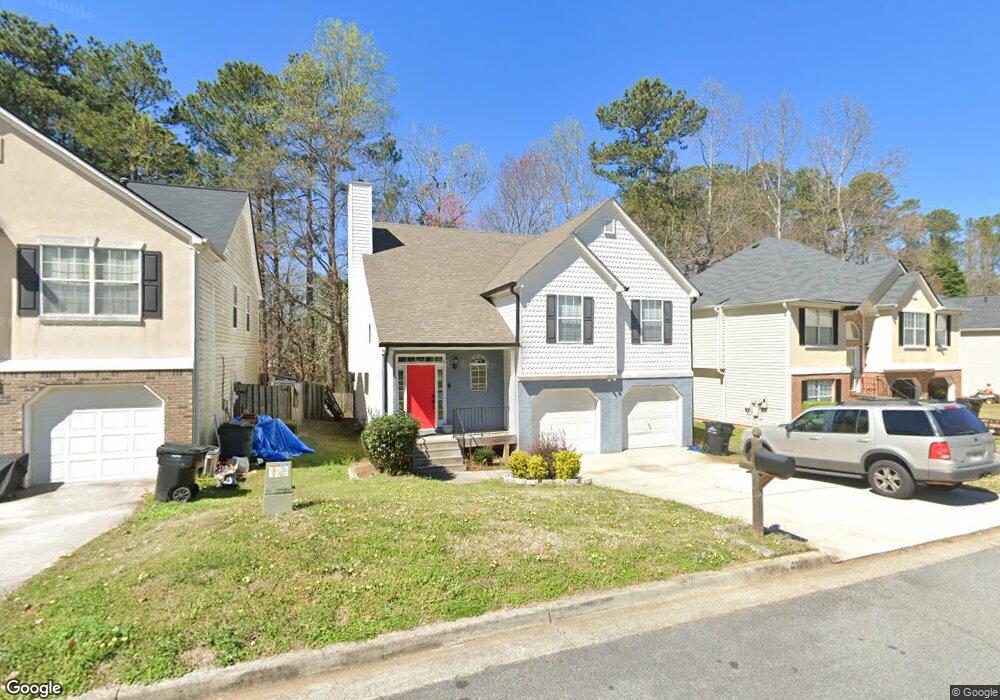
4382 Stonecrest Dr Austell, GA 30106
Estimated Value: $340,989 - $368,000
4
Beds
3
Baths
1,394
Sq Ft
$251/Sq Ft
Est. Value
About This Home
This home is located at 4382 Stonecrest Dr, Austell, GA 30106 and is currently estimated at $349,747, approximately $250 per square foot. 4382 Stonecrest Dr is a home located in Cobb County with nearby schools including Clarkdale Elementary School, Garrett Middle School, and South Cobb High School.
Ownership History
Date
Name
Owned For
Owner Type
Purchase Details
Closed on
Sep 26, 2008
Sold by
Nobles Michelle F
Bought by
Nobles James and Nobles Michelle F
Current Estimated Value
Home Financials for this Owner
Home Financials are based on the most recent Mortgage that was taken out on this home.
Original Mortgage
$183,097
Outstanding Balance
$121,376
Interest Rate
6.45%
Mortgage Type
FHA
Estimated Equity
$228,371
Purchase Details
Closed on
Jun 1, 2005
Sold by
W & H Properties Llc
Bought by
Stonecrest Hoa Inc
Purchase Details
Closed on
Jun 29, 2001
Sold by
W & H Properties Llc
Bought by
Brown Ferron
Home Financials for this Owner
Home Financials are based on the most recent Mortgage that was taken out on this home.
Original Mortgage
$119,120
Interest Rate
8.75%
Mortgage Type
New Conventional
Create a Home Valuation Report for This Property
The Home Valuation Report is an in-depth analysis detailing your home's value as well as a comparison with similar homes in the area
Home Values in the Area
Average Home Value in this Area
Purchase History
| Date | Buyer | Sale Price | Title Company |
|---|---|---|---|
| Nobles James | -- | -- | |
| Nobles Michelle F | $185,000 | -- | |
| Stonecrest Hoa Inc | $1,000 | -- | |
| Brown Ferron | $148,900 | -- |
Source: Public Records
Mortgage History
| Date | Status | Borrower | Loan Amount |
|---|---|---|---|
| Open | Nobles Michelle F | $183,097 | |
| Previous Owner | Brown Ferron | $119,120 |
Source: Public Records
Tax History
| Year | Tax Paid | Tax Assessment Tax Assessment Total Assessment is a certain percentage of the fair market value that is determined by local assessors to be the total taxable value of land and additions on the property. | Land | Improvement |
|---|---|---|---|---|
| 2025 | $3,275 | $139,896 | $36,000 | $103,896 |
| 2024 | $3,027 | $128,336 | $34,000 | $94,336 |
| 2023 | $2,026 | $107,184 | $20,000 | $87,184 |
Source: Public Records
Map
Nearby Homes
- 2012 Drennon Ave
- 2034 Drennon Ave
- 2050 Lenoa Ln
- 4349 Kousa Rd Unit 4
- 2081 Lenoa Ln
- 2083 Lenoa Ln
- 2085 Lenoa Ln
- 2035 Mcduffie Rd
- 2013 Chesley Dr
- 1756 Fairview Cir
- 4329 Yellow Rose Dr
- 1808 Elmwood Dr
- 4420 Pink Rose Ct
- 1791 Fairview Dr SW
- 2110 Plum Ln
- 4390 Chelou Dr
- 4630 Hemlock Dr
- 4814 Clove Dr SW
- 1741 Seayes Rd
- 2349 Shire Ct
- 4386 Stonecrest Dr
- 4390 Stonecrest Dr
- 4390 Stonecrest Dr Unit GAA0357
- 4390 Stonecrest Dr Unit Gaa035
- 4378 Stonecrest Dr
- 4385 Stonecrest Dr
- 4394 Stonecrest Dr
- 4374 Stonecrest Dr
- 1979 Stonecrest Ct
- 4389 Stonecrest Dr
- 4393 Stonecrest Dr
- 4370 Stonecrest Dr
- 4370 Stonecrest Dr Unit 11
- 2018 Drennon Ave
- 4373 Stonecrest Dr
- 1984 Drennon Ave
- 1986 Drennon Ave
- 2016 Drennon Ave
- 1970 Stonecrest Ct
- 1947 Padgett Dr