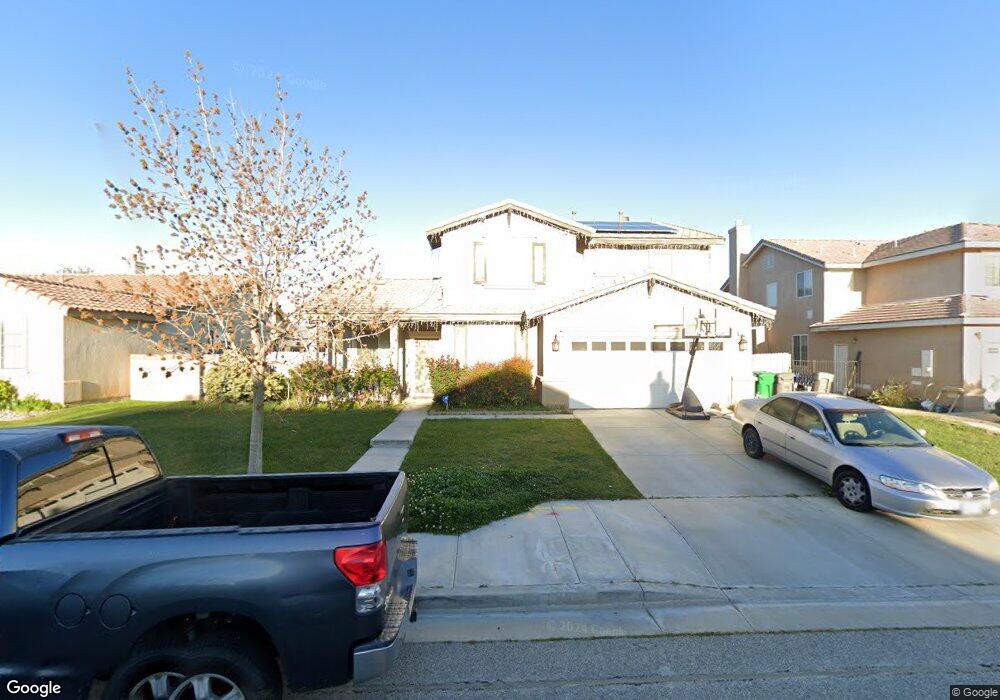
43823 Freer Way Lancaster, CA 93536
West Lancaster NeighborhoodEstimated Value: $578,633 - $643,000
3
Beds
3
Baths
3,096
Sq Ft
$195/Sq Ft
Est. Value
About This Home
This home is located at 43823 Freer Way, Lancaster, CA 93536 and is currently estimated at $604,658, approximately $195 per square foot. 43823 Freer Way is a home located in Los Angeles County with nearby schools including Sundown Elementary School, Quartz Hill High School, and Fabunni Private School Inc..
Ownership History
Date
Name
Owned For
Owner Type
Purchase Details
Closed on
Jun 4, 2014
Sold by
Guzman Mario R
Bought by
Guzman Mario R and Perez Carina O
Current Estimated Value
Home Financials for this Owner
Home Financials are based on the most recent Mortgage that was taken out on this home.
Original Mortgage
$194,500
Outstanding Balance
$148,219
Interest Rate
4.25%
Mortgage Type
New Conventional
Estimated Equity
$456,439
Purchase Details
Closed on
Jun 23, 2010
Sold by
Ramezani Arash
Bought by
Guzman Mario R and Perez Carina O
Home Financials for this Owner
Home Financials are based on the most recent Mortgage that was taken out on this home.
Original Mortgage
$201,289
Interest Rate
4.75%
Mortgage Type
FHA
Purchase Details
Closed on
May 10, 2005
Sold by
Standard Pacific Corp
Bought by
Ramezani Arash
Home Financials for this Owner
Home Financials are based on the most recent Mortgage that was taken out on this home.
Original Mortgage
$284,800
Interest Rate
5.5%
Mortgage Type
Fannie Mae Freddie Mac
Create a Home Valuation Report for This Property
The Home Valuation Report is an in-depth analysis detailing your home's value as well as a comparison with similar homes in the area
Home Values in the Area
Average Home Value in this Area
Purchase History
| Date | Buyer | Sale Price | Title Company |
|---|---|---|---|
| Guzman Mario R | -- | None Available | |
| Guzman Mario R | $204,000 | Old Republic Title | |
| Ramezani Arash | $356,500 | Lawyers Title |
Source: Public Records
Mortgage History
| Date | Status | Borrower | Loan Amount |
|---|---|---|---|
| Open | Guzman Mario R | $194,500 | |
| Previous Owner | Guzman Mario R | $201,289 | |
| Previous Owner | Ramezani Arash | $284,800 | |
| Closed | Ramezani Arash | $71,200 |
Source: Public Records
Tax History
| Year | Tax Paid | Tax Assessment Tax Assessment Total Assessment is a certain percentage of the fair market value that is determined by local assessors to be the total taxable value of land and additions on the property. | Land | Improvement |
|---|---|---|---|---|
| 2025 | $4,781 | $261,347 | $52,265 | $209,082 |
| 2024 | $4,781 | $256,224 | $51,241 | $204,983 |
| 2023 | $4,723 | $251,201 | $50,237 | $200,964 |
| 2022 | $4,506 | $246,276 | $49,252 | $197,024 |
| 2021 | $4,075 | $241,448 | $48,287 | $193,161 |
| 2019 | $3,972 | $234,288 | $46,855 | $187,433 |
| 2018 | $3,914 | $229,695 | $45,937 | $183,758 |
| 2016 | $3,691 | $220,777 | $44,154 | $176,623 |
| 2015 | $3,648 | $217,461 | $43,491 | $173,970 |
| 2014 | $3,633 | $213,203 | $42,640 | $170,563 |
Source: Public Records
Map
Nearby Homes
- 43749 Tahoe Way
- 6223 W Avenue j12
- 0 65th St West and J8 Unit 25002929
- 0 Vic Avenue J12 67 Stw
- 6135 W Avenue J 9
- 6147 W Avenue j15
- 60 Stw Vic Ave
- 0 70th St West & Ave J10 Unit 25006970
- 0 61st St W
- 6144 Treehaven Ct
- 44220 Encanto Way
- 43645 59th St W
- 43637 59th St W
- 6157 W Avenue j4
- 44238 Encanto Way
- 44241 Tahoe Way
- 3626 W Avenue J 2
- 0 Vac Cor Ave K4 85th
- 43407 Hampton St
- 60 W Avenue J-4
- 43829 Freer Way
- 43815 Freer Way
- 43809 Freer Way
- 43837 Freer Way
- 43822 Freer Way
- 6338 W Avenue j11
- 43816 Freer Way
- 43803 Freer Way
- 43808 Freer Way
- 6330 W Avenue j11
- 43802 Freer Way
- 43823 Encanto Way
- 43815 Encanto Way
- 43851 Freer Way
- 6337 W Avenue j11
- 6324 W Avenue j11
- 43809 Encanto Way
- 6331 W Avenue j11
- 43857 Freer Way
- 43856 Freer Way
Your Personal Tour Guide
Ask me questions while you tour the home.