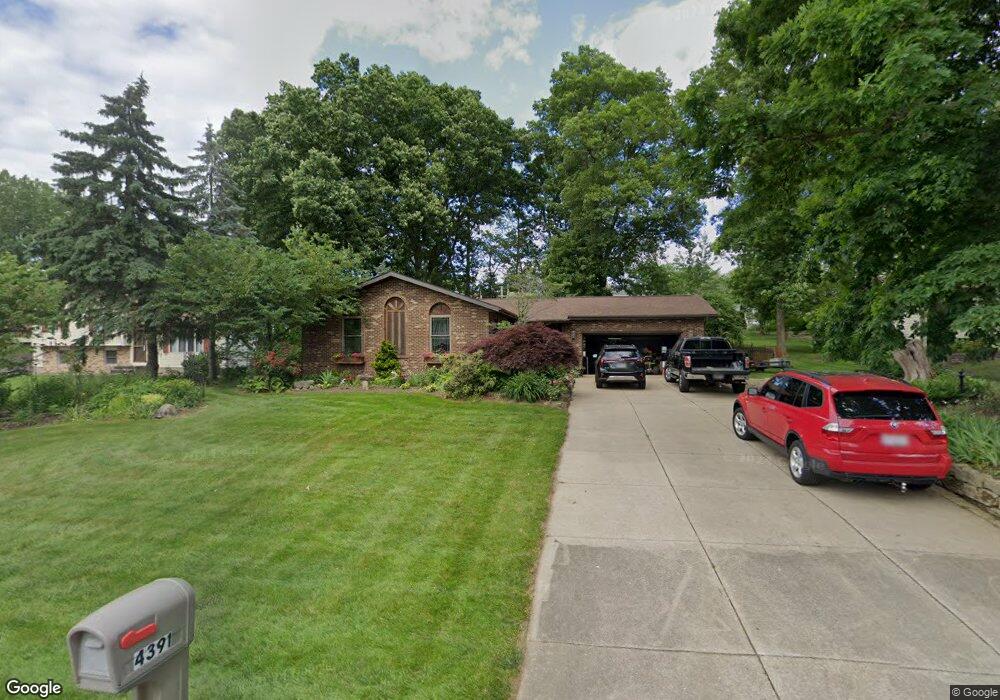
4383 Rayel Cir Uniontown, OH 44685
Estimated Value: $242,000 - $351,000
3
Beds
2
Baths
1,232
Sq Ft
$230/Sq Ft
Est. Value
About This Home
This home is located at 4383 Rayel Cir, Uniontown, OH 44685 and is currently estimated at $283,338, approximately $229 per square foot. 4383 Rayel Cir is a home located in Summit County with nearby schools including Greenwood Elementary School, Green Intermediate Elementary School, and Green Primary School.
Ownership History
Date
Name
Owned For
Owner Type
Purchase Details
Closed on
Aug 21, 2024
Sold by
Davis Timothy D
Bought by
Mason Aaron C and Mason Kristin E
Current Estimated Value
Home Financials for this Owner
Home Financials are based on the most recent Mortgage that was taken out on this home.
Original Mortgage
$180,000
Outstanding Balance
$177,971
Interest Rate
6.89%
Mortgage Type
Credit Line Revolving
Estimated Equity
$105,367
Purchase Details
Closed on
Oct 5, 2002
Sold by
Davis Elizabeth J
Bought by
Davis Timothy D
Home Financials for this Owner
Home Financials are based on the most recent Mortgage that was taken out on this home.
Original Mortgage
$100,000
Interest Rate
6.24%
Purchase Details
Closed on
Jan 8, 1999
Sold by
Davis Elizabeth J
Bought by
Davis Timothy D and Davis Elizabeth J
Create a Home Valuation Report for This Property
The Home Valuation Report is an in-depth analysis detailing your home's value as well as a comparison with similar homes in the area
Home Values in the Area
Average Home Value in this Area
Purchase History
| Date | Buyer | Sale Price | Title Company |
|---|---|---|---|
| Mason Aaron C | $240,000 | None Listed On Document | |
| Davis Timothy D | -- | Advanced Title | |
| Davis Timothy D | -- | Approved Statewide Title Age |
Source: Public Records
Mortgage History
| Date | Status | Borrower | Loan Amount |
|---|---|---|---|
| Open | Mason Aaron C | $180,000 | |
| Previous Owner | Davis Timothy D | $100,000 |
Source: Public Records
Tax History Compared to Growth
Tax History
| Year | Tax Paid | Tax Assessment Tax Assessment Total Assessment is a certain percentage of the fair market value that is determined by local assessors to be the total taxable value of land and additions on the property. | Land | Improvement |
|---|---|---|---|---|
| 2025 | $4,059 | $85,407 | $20,083 | $65,324 |
| 2024 | $4,059 | $85,407 | $20,083 | $65,324 |
| 2023 | $4,059 | $85,407 | $20,083 | $65,324 |
| 2022 | $3,246 | $61,117 | $14,343 | $46,774 |
| 2021 | $3,045 | $61,117 | $14,343 | $46,774 |
| 2020 | $2,988 | $61,110 | $14,340 | $46,770 |
| 2019 | $3,540 | $52,370 | $11,990 | $40,380 |
| 2018 | $2,797 | $52,370 | $11,990 | $40,380 |
| 2017 | $2,521 | $52,370 | $11,990 | $40,380 |
| 2016 | $2,509 | $44,220 | $11,990 | $32,230 |
| 2015 | $2,521 | $44,220 | $11,990 | $32,230 |
| 2014 | $2,505 | $44,220 | $11,990 | $32,230 |
| 2013 | $2,565 | $45,000 | $11,990 | $33,010 |
Source: Public Records
Map
Nearby Homes
- 4350 Sunnyview Dr
- 4440 Shriver Rd
- 4426 Royce Ave
- 1659 King Dr
- 1499 King Dr
- 4301 Evergreen Ct Unit 63
- 4324 Evergreen Ct Unit 53
- 4317 Evergreen Ct Unit 67
- 1425 Hazeldell Dr
- 4384 Massillon Rd
- 4237 Springdale Rd
- 1501 Spring Wood Ln
- V/L Massillon Rd
- 4304 Evergreen Ct Unit 61
- Palazzo Plan at The Courtyards at New Seasons
- Torino Plan at The Courtyards at New Seasons
- Promenade III Plan at The Courtyards at New Seasons
- Capri Plan at The Courtyards at New Seasons
- Portico Plan at The Courtyards at New Seasons
- 4451 Dogwood Ct Unit 31
- 4391 Rayel Cir
- 1591 Hightower Dr
- 4401 Rayel Cir
- 4374 Sunnyview Dr
- 4384 Sunnyview Dr
- 1581 Hightower Dr
- 4366 Sunnyview Dr
- 4394 Sunnyview Dr
- 1576 Hightower Dr
- 4411 Rayel Cir
- 4358 Sunnyview Dr
- 4357 Maplewood Dr
- 4400 Rayel Cir
- 1571 Hightower Dr
- 4402 Sunnyview Dr
- 4410 Rayel Cir
- 4410 Sunnyview Dr
- 1641 Amaryllis Dr
- 4421 Rayel Cir
- 1561 Hightower Dr