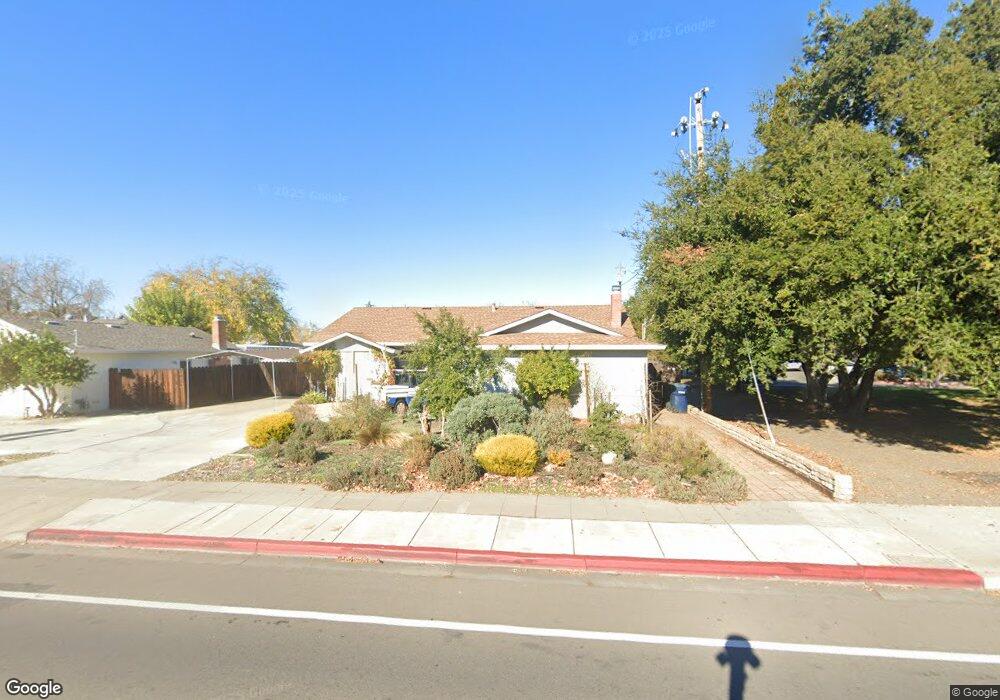
4384 East Ave Livermore, CA 94550
Jensen NeighborhoodEstimated Value: $998,000 - $1,131,000
3
Beds
2
Baths
1,616
Sq Ft
$663/Sq Ft
Est. Value
About This Home
This home is located at 4384 East Ave, Livermore, CA 94550 and is currently estimated at $1,071,989, approximately $663 per square foot. 4384 East Ave is a home located in Alameda County with nearby schools including Jackson Avenue Elementary School, East Avenue Middle School, and Livermore High School.
Ownership History
Date
Name
Owned For
Owner Type
Purchase Details
Closed on
Jun 2, 2017
Sold by
Regan Dennis T and Regan Mary Jane
Bought by
Stoops Lorne
Current Estimated Value
Purchase Details
Closed on
Aug 20, 2015
Sold by
Regan Dennis T and Regan Mary J
Bought by
Dennis Thomas Regan & Mary Jane Regan Re
Purchase Details
Closed on
Jun 24, 2013
Sold by
Bell Milton D and Bell Margaret A
Bought by
Regan Dennis T
Home Financials for this Owner
Home Financials are based on the most recent Mortgage that was taken out on this home.
Original Mortgage
$400,000
Interest Rate
3.48%
Mortgage Type
New Conventional
Purchase Details
Closed on
Apr 11, 2001
Sold by
Bell Milton D and Holinsworth Bell Margaret A
Bought by
Bell Milton D and Bell Margaret A
Home Financials for this Owner
Home Financials are based on the most recent Mortgage that was taken out on this home.
Original Mortgage
$237,300
Interest Rate
7.09%
Create a Home Valuation Report for This Property
The Home Valuation Report is an in-depth analysis detailing your home's value as well as a comparison with similar homes in the area
Home Values in the Area
Average Home Value in this Area
Purchase History
| Date | Buyer | Sale Price | Title Company |
|---|---|---|---|
| Stoops Lorne | $686,000 | Chicago Title Company | |
| Dennis Thomas Regan & Mary Jane Regan Re | -- | None Available | |
| Regan Dennis T | $505,000 | Fidelity National Title Co | |
| Regan Dennis T | -- | Fidelity National Title Co | |
| Bell Milton D | -- | Landsafe Title Company |
Source: Public Records
Mortgage History
| Date | Status | Borrower | Loan Amount |
|---|---|---|---|
| Previous Owner | Regan Dennis T | $400,000 | |
| Previous Owner | Bell Milton D | $237,300 |
Source: Public Records
Tax History Compared to Growth
Tax History
| Year | Tax Paid | Tax Assessment Tax Assessment Total Assessment is a certain percentage of the fair market value that is determined by local assessors to be the total taxable value of land and additions on the property. | Land | Improvement |
|---|---|---|---|---|
| 2025 | $9,926 | $789,143 | $238,843 | $557,300 |
| 2024 | $9,926 | $773,537 | $234,161 | $546,376 |
| 2023 | $9,782 | $765,232 | $229,569 | $535,663 |
| 2022 | $9,645 | $743,230 | $225,069 | $525,161 |
| 2021 | $8,709 | $728,521 | $220,656 | $514,865 |
| 2020 | $9,180 | $727,982 | $218,394 | $509,588 |
| 2019 | $9,222 | $713,714 | $214,114 | $499,600 |
| 2018 | $9,030 | $699,720 | $209,916 | $489,804 |
| 2017 | $7,018 | $533,400 | $160,020 | $373,380 |
| 2016 | $6,756 | $522,941 | $156,882 | $366,059 |
| 2015 | $6,340 | $515,088 | $154,526 | $360,562 |
| 2014 | $6,229 | $505,000 | $151,500 | $353,500 |
Source: Public Records
Map
Nearby Homes
- 438 Harding Ave
- 3992 Yale Way
- 4936 Gladys Ct
- 3959 Purdue Way
- 202 Sonia Way
- 4844 Mulqueeney Common
- 3734 Carrigan Common
- 5163 Charlotte Way
- 5311 Charlotte Way
- 838 Hazel St
- 4803 Andrea Ct
- 5590 Hopps Ln
- 2599 Cooper Cir
- 4715 Marengo Common
- 4711 Marengo Common
- 4707 Marengo Common
- Residence 2 Plan at Arroyo Crossings - Amara at Arroyo Crossings
- Residence 3 Plan at Arroyo Crossings - Verdello at Arroyo Crossings
- Residence 3 Plan at Arroyo Crossings - Solera at Arroyo Crossings
- Residence 1 Plan at Arroyo Crossings - Solera at Arroyo Crossings
- 4372 East Ave
- 4387 Claremont Way
- 4375 Claremont Way
- 4360 East Ave
- 4363 Claremont Way
- 4348 East Ave
- 4343 Claremont Way
- 1033 Auburn St
- 1029 Madison Ave
- 4329 Claremont Way
- 4390 Claremont Way
- 4336 East Ave
- 4376 Claremont Way
- 1045 Auburn St
- 4364 Claremont Way
- 1042 Madison Ave
- 4347 East Ave
- 1032 Auburn St
- 4317 Claremont Way
- 886 Adams Ave