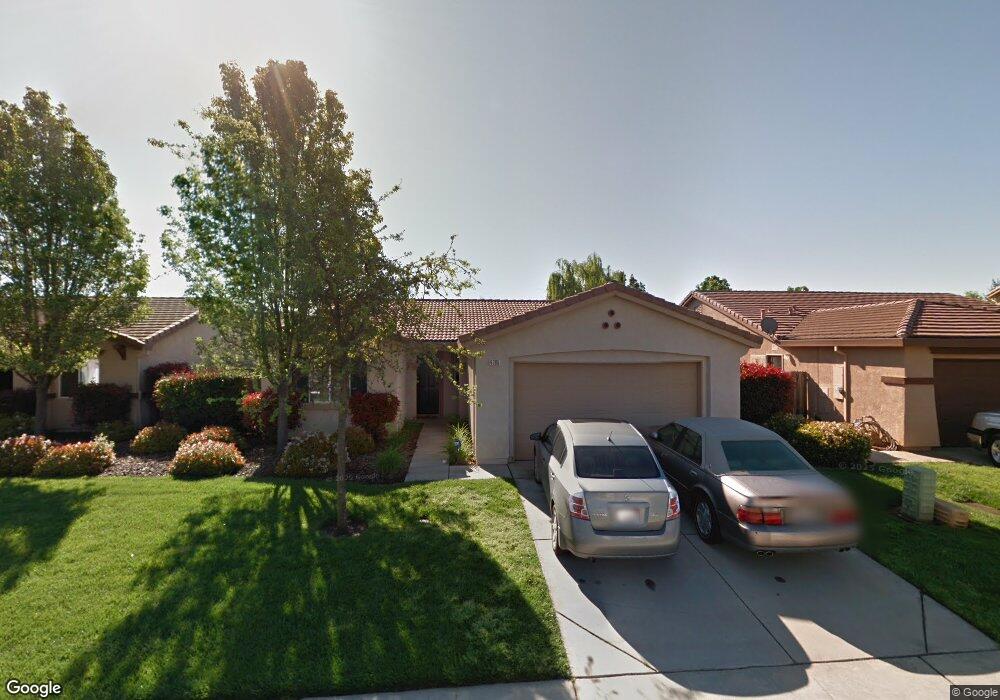
4385 Monhegan Way Mather, CA 95655
Estimated Value: $401,000 - $494,000
3
Beds
2
Baths
1,479
Sq Ft
$313/Sq Ft
Est. Value
About This Home
This home is located at 4385 Monhegan Way, Mather, CA 95655 and is currently estimated at $462,390, approximately $312 per square foot. 4385 Monhegan Way is a home located in Sacramento County with nearby schools including Mather Heights Elementary School, W.E. Mitchell Middle School, and Cordova High School.
Ownership History
Date
Name
Owned For
Owner Type
Purchase Details
Closed on
Sep 19, 2002
Sold by
Mather Housing Company Llc
Bought by
Burnett Francine L and Moore Gwendolyn
Current Estimated Value
Home Financials for this Owner
Home Financials are based on the most recent Mortgage that was taken out on this home.
Original Mortgage
$170,388
Outstanding Balance
$70,761
Interest Rate
6.16%
Mortgage Type
FHA
Estimated Equity
$391,629
Create a Home Valuation Report for This Property
The Home Valuation Report is an in-depth analysis detailing your home's value as well as a comparison with similar homes in the area
Home Values in the Area
Average Home Value in this Area
Purchase History
| Date | Buyer | Sale Price | Title Company |
|---|---|---|---|
| Burnett Francine L | $173,500 | First American Title Ins Co |
Source: Public Records
Mortgage History
| Date | Status | Borrower | Loan Amount |
|---|---|---|---|
| Open | Burnett Francine L | $170,388 | |
| Closed | Burnett Francine L | $5,191 |
Source: Public Records
Tax History Compared to Growth
Tax History
| Year | Tax Paid | Tax Assessment Tax Assessment Total Assessment is a certain percentage of the fair market value that is determined by local assessors to be the total taxable value of land and additions on the property. | Land | Improvement |
|---|---|---|---|---|
| 2025 | $3,140 | $250,627 | $79,646 | $170,981 |
| 2024 | $3,140 | $245,714 | $78,085 | $167,629 |
| 2023 | $3,073 | $240,897 | $76,554 | $164,343 |
| 2022 | $3,022 | $236,174 | $75,053 | $161,121 |
| 2021 | $2,960 | $231,544 | $73,582 | $157,962 |
| 2020 | $2,954 | $229,171 | $72,828 | $156,343 |
| 2019 | $2,906 | $224,678 | $71,400 | $153,278 |
| 2018 | $2,832 | $220,273 | $70,000 | $150,273 |
| 2017 | $2,762 | $215,955 | $68,628 | $147,327 |
| 2016 | $2,762 | $211,722 | $67,283 | $144,439 |
| 2015 | $2,631 | $208,543 | $66,273 | $142,270 |
| 2014 | $2,780 | $204,459 | $64,975 | $139,484 |
Source: Public Records
Map
Nearby Homes
- 4627 Excelsior Rd
- 4274 Stromford Way
- 4277 Aubergine Way
- 4272 Aubergine Way
- 4313 Narraganset Way
- 10893 Woolwich Way
- 10961 Woolwich Way
- 4461 Bran St
- 4460 Bran St
- 3557 Rainsong Cir
- 3504 Misty Morning Cir
- 3505 Husch Way
- 3478 Nut Plains Dr
- 10246 Pistachio Way
- 3404 Nouveau Way
- 10843 Windrow Way
- 10836 Windrow Way
- 3474 Russet Way
- 3470 Russet Way
- 10937 Bushel Way
- 4381 Monhegan Way
- 4389 Monhegan Way
- 10739 Ivoryton Way
- 4377 Monhegan Way
- 4393 Monhegan Way
- 10743 Ivoryton Way
- 10735 Ivoryton Way
- 4390 Monhegan Way
- 4382 Monhegan Way
- 10731 Ivoryton Way
- 10747 Ivoryton Way
- 4373 Monhegan Way
- 4397 Monhegan Way
- 4378 Monhegan Way
- 10727 Ivoryton Way
- 10751 Ivoryton Way
- 4369 Monhegan Way
- 4374 Monhegan Way
- 4401 Monhegan Way
- 4405 Aubergine Way