Estimated Value: $315,000 - $356,000
4
Beds
2
Baths
2,157
Sq Ft
$155/Sq Ft
Est. Value
About This Home
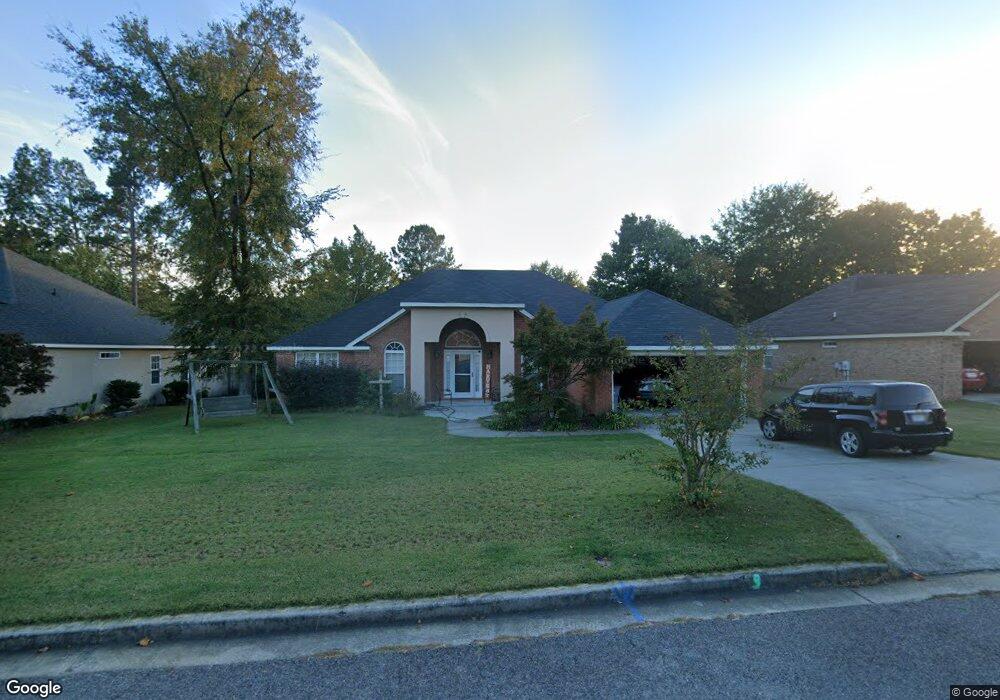
This home is located at 4386 Marshall Way, Evans, GA 30809 and is currently estimated at $333,368, approximately $154 per square foot. 4386 Marshall Way is a home located in Columbia County with nearby schools including River Ridge Elementary School, Riverside Middle School, and Lakeside High School.
Ownership History
Date
Name
Owned For
Owner Type
Purchase Details
Closed on
Apr 20, 2020
Sold by
Mack Denny R
Bought by
Mack Vickie L
Current Estimated Value
Home Financials for this Owner
Home Financials are based on the most recent Mortgage that was taken out on this home.
Original Mortgage
$168,200
Outstanding Balance
$149,562
Interest Rate
3.6%
Mortgage Type
New Conventional
Estimated Equity
$183,806
Purchase Details
Closed on
May 30, 2003
Sold by
Jolly Erin A
Bought by
Mack Vickie L
Home Financials for this Owner
Home Financials are based on the most recent Mortgage that was taken out on this home.
Original Mortgage
$151,522
Interest Rate
5.79%
Mortgage Type
FHA
Purchase Details
Closed on
May 17, 2002
Sold by
Ocain George E and Ocain Tammi R
Bought by
Jolly Erin A
Home Financials for this Owner
Home Financials are based on the most recent Mortgage that was taken out on this home.
Original Mortgage
$123,050
Interest Rate
6.85%
Create a Home Valuation Report for This Property
The Home Valuation Report is an in-depth analysis detailing your home's value as well as a comparison with similar homes in the area
Home Values in the Area
Average Home Value in this Area
Purchase History
| Date | Buyer | Sale Price | Title Company |
|---|---|---|---|
| Mack Vickie L | -- | -- | |
| Mack Vickie L | $153,900 | -- | |
| Jolly Erin A | $153,900 | -- |
Source: Public Records
Mortgage History
| Date | Status | Borrower | Loan Amount |
|---|---|---|---|
| Open | Mack Vickie L | $168,200 | |
| Previous Owner | Mack Vickie L | $151,522 | |
| Previous Owner | Jolly Erin A | $123,050 |
Source: Public Records
Tax History
| Year | Tax Paid | Tax Assessment Tax Assessment Total Assessment is a certain percentage of the fair market value that is determined by local assessors to be the total taxable value of land and additions on the property. | Land | Improvement |
|---|---|---|---|---|
| 2025 | $2,967 | $123,935 | $25,804 | $98,131 |
| 2024 | $3,345 | $133,489 | $25,804 | $107,685 |
| 2023 | $3,345 | $110,396 | $20,604 | $89,792 |
| 2022 | $2,686 | $103,074 | $19,304 | $83,770 |
| 2021 | $2,588 | $94,987 | $18,704 | $76,283 |
| 2020 | $2,568 | $92,331 | $18,204 | $74,127 |
| 2019 | $2,390 | $85,899 | $16,404 | $69,495 |
| 2018 | $2,310 | $82,730 | $15,404 | $67,326 |
| 2017 | $2,315 | $82,628 | $15,904 | $66,724 |
| 2016 | $2,124 | $78,615 | $15,180 | $63,435 |
| 2015 | $1,939 | $71,612 | $14,180 | $57,432 |
| 2014 | $1,986 | $72,476 | $14,180 | $58,296 |
Source: Public Records
Map
Nearby Homes
- 839 Prairie Ln
- 780 Springbrook Cir
- 4222 Deerwood Ln
- 809 Woodberry Dr
- 612 Emerald Crossing
- 628 Emerald Crossing
- 829 Woodberry Dr
- 4478 Cape Cod Dr
- 4418 Pierwood Way
- 854 Sparkleberry Rd
- 4481 Woodberry Ct
- 4484 Woodberry Ct
- 4489 Woodberry Ct
- 929 Burlington Dr
- 4305 Southern Pines Dr
- 936 Deercrest Cir
- 934 Deercrest Cir
- 644 Deerwood Way
- 802 Sparkleberry Rd
- 4449 Pierwood Way
- 4384 Marshall Way
- 4388 Marshall Way
- 4390 Marshall Way
- 4382 Marshall Way
- 4383 Marshall Way
- 4385 Marshall Way
- 780 Prairie Ln
- 4387 Marshall Way
- 4380 Marshall Way
- 4392 Marshall Way
- 4379 Marshall Way
- 4389 Marshall Way
- 4394 Marshall Way
- 4378 Marshall Way
- 4404 Kameron Ct
- 4406 Kameron Ct
- 4402 Kameron Ct
- 4404 Kameroon Ct
- 4402 Kameroon Ct
- 4408 Kameron Ct
Your Personal Tour Guide
Ask me questions while you tour the home.