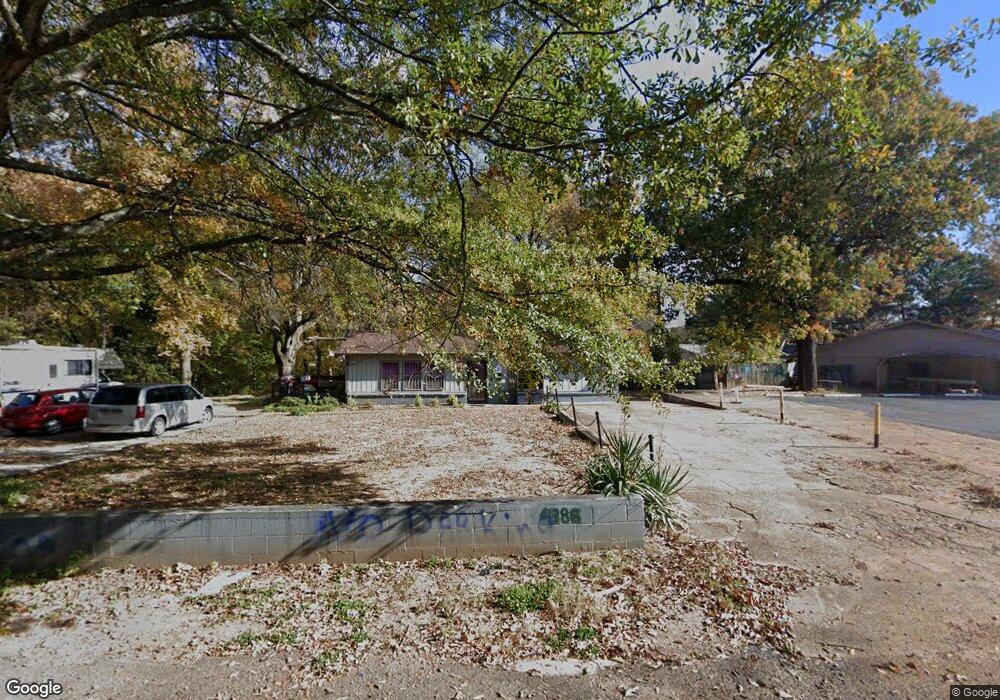
4386 Raleigh Lagrange Rd Memphis, TN 38128
Raleigh NeighborhoodEstimated Value: $108,136
--
Bed
--
Bath
2,142
Sq Ft
$50/Sq Ft
Est. Value
About This Home
This home is located at 4386 Raleigh Lagrange Rd, Memphis, TN 38128 and is currently estimated at $108,136, approximately $50 per square foot. 4386 Raleigh Lagrange Rd is a home located in Shelby County with nearby schools including Craigmont Middle School, Craigmont High School, and Coleman School.
Ownership History
Date
Name
Owned For
Owner Type
Purchase Details
Closed on
Nov 21, 2023
Sold by
Smith Desiree N
Bought by
Diaz Juan Josue
Current Estimated Value
Purchase Details
Closed on
Nov 28, 2022
Sold by
Robbins Arzo Denton
Bought by
Smith Desiree N
Purchase Details
Closed on
May 21, 2019
Sold by
Mabry Thomas G
Bought by
Robbins Arzo D
Home Financials for this Owner
Home Financials are based on the most recent Mortgage that was taken out on this home.
Original Mortgage
$105,000
Interest Rate
4.1%
Mortgage Type
New Conventional
Purchase Details
Closed on
Mar 23, 2011
Sold by
Pope Patricia L
Bought by
Mabry Thomas G
Purchase Details
Closed on
Mar 26, 2009
Sold by
Mabry Thomas G
Bought by
Pope Patricia L
Purchase Details
Closed on
Sep 2, 1997
Sold by
Earwood Rita Woody
Bought by
Mabry Thomas G
Create a Home Valuation Report for This Property
The Home Valuation Report is an in-depth analysis detailing your home's value as well as a comparison with similar homes in the area
Home Values in the Area
Average Home Value in this Area
Purchase History
| Date | Buyer | Sale Price | Title Company |
|---|---|---|---|
| Diaz Juan Josue | $100,000 | Foundation Title & Escrow | |
| Smith Desiree N | -- | -- | |
| Robbins Arzo D | $120,000 | None Available | |
| Mabry Thomas G | -- | None Available | |
| Pope Patricia L | -- | None Available | |
| Mabry Thomas G | -- | -- |
Source: Public Records
Mortgage History
| Date | Status | Borrower | Loan Amount |
|---|---|---|---|
| Previous Owner | Robbins Arzo D | $105,000 |
Source: Public Records
Tax History Compared to Growth
Tax History
| Year | Tax Paid | Tax Assessment Tax Assessment Total Assessment is a certain percentage of the fair market value that is determined by local assessors to be the total taxable value of land and additions on the property. | Land | Improvement |
|---|---|---|---|---|
| 2025 | $2,134 | $71,480 | $22,640 | $48,840 |
| 2024 | $2,134 | $62,960 | $20,880 | $42,080 |
| 2023 | $3,835 | $62,960 | $26,280 | $36,680 |
| 2022 | $3,835 | $62,960 | $26,280 | $36,680 |
| 2021 | $2,172 | $62,960 | $26,280 | $36,680 |
| 2020 | $2,368 | $32,680 | $26,280 | $6,400 |
| 2019 | $1,044 | $32,680 | $26,280 | $6,400 |
| 2018 | $1,044 | $32,680 | $26,280 | $6,400 |
| 2017 | $1,069 | $32,680 | $26,280 | $6,400 |
| 2016 | $1,449 | $33,160 | $0 | $0 |
| 2014 | $1,449 | $49,000 | $0 | $0 |
Source: Public Records
Map
Nearby Homes
- 2853 Beverly Hills Rd
- 2868 East St
- 4564 Stage Rd
- 0 Raleigh Millington Rd
- 3051 Overbrook Dr
- 4480 Tanbark Ave
- 4675 Raleigh Lagrange Rd
- 4678 Gunsmoke Ave
- 0 Wendt Ave
- 3002 Robbiedon St
- 3012 Robbiedon St
- 4503 Lockwood Cove
- 0 Stage Rd Unit 10201799
- 2568 Parkview Dr
- 4706 Stage Rd
- 3090 Earnett St
- 3083 Kenneth St
- 4668 Casann Ave
- 3287 Leschallas Dr
- 3279 Hanna Dr
- 2811 Beverly Hills Rd
- 2816 Hammond Rd
- 2789 Beverly Hill St Unit 7
- 2821 Beverly Hills Rd
- 2783 Beverly Hills Rd
- 2836 Hammond Rd
- 2806 Beverly Hills Rd
- 4390 Kamali Ct
- 2839 Beverly Hills Rd
- 2780 Raleigh Lagrange Rd
- 2780 Raleigh Lagrange Rd Unit 2782 The Springs Ct.
- 2816 Beverly Hills Rd
- 2833 Beverly Hills Rd
- 4362 Raleigh Lagrange Rd
- 2775 the Springs Ct
- 2775 the Springs Ct Unit 2777
- 2775 the Springs Ct Unit 2775
- 2846 Hammond Rd
- 2830 Beverly Hill St
- 2830 Beverly Hills Rd