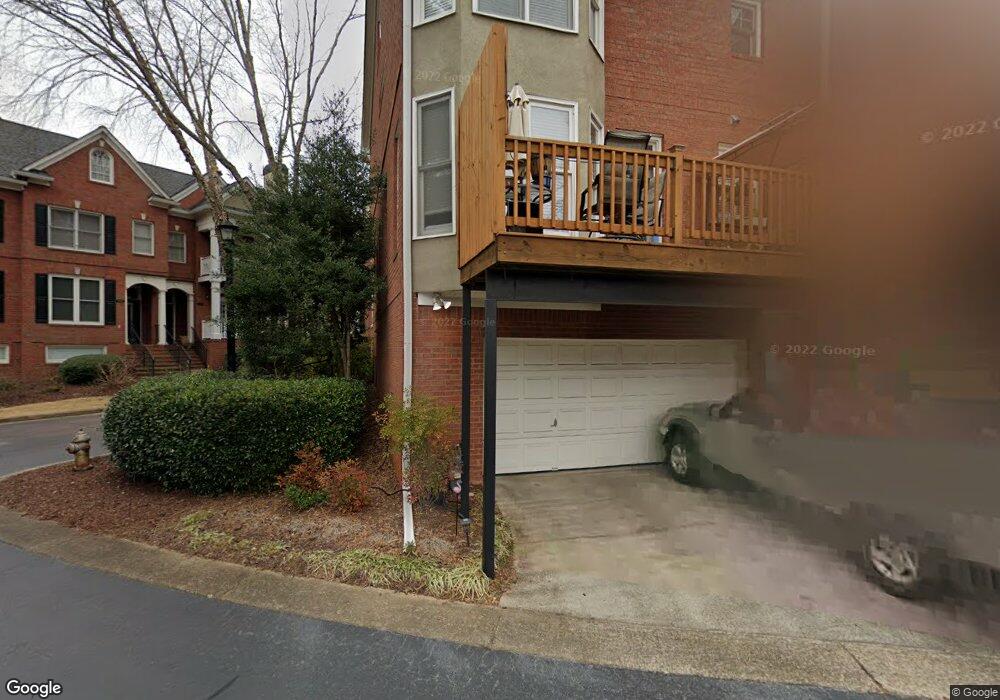
4388 Paces Point Cir SE Smyrna, GA 30080
Estimated Value: $434,123 - $547,000
3
Beds
4
Baths
2,652
Sq Ft
$183/Sq Ft
Est. Value
About This Home
This home is located at 4388 Paces Point Cir SE, Smyrna, GA 30080 and is currently estimated at $485,281, approximately $182 per square foot. 4388 Paces Point Cir SE is a home located in Cobb County with nearby schools including Nickajack Elementary School, Campbell Middle School, and Campbell High School.
Ownership History
Date
Name
Owned For
Owner Type
Purchase Details
Closed on
Nov 12, 2010
Sold by
Ritsema John D
Bought by
Kirar Michael
Current Estimated Value
Home Financials for this Owner
Home Financials are based on the most recent Mortgage that was taken out on this home.
Original Mortgage
$227,000
Interest Rate
4.42%
Mortgage Type
New Conventional
Purchase Details
Closed on
Nov 30, 2001
Sold by
Gebert Susan and Gebert David
Bought by
Troutman Kevin W
Home Financials for this Owner
Home Financials are based on the most recent Mortgage that was taken out on this home.
Original Mortgage
$208,000
Interest Rate
6.6%
Mortgage Type
New Conventional
Purchase Details
Closed on
Mar 19, 1999
Sold by
John Wieland Homes
Bought by
Hebert David and Hebert Susan
Home Financials for this Owner
Home Financials are based on the most recent Mortgage that was taken out on this home.
Original Mortgage
$204,950
Interest Rate
7.08%
Mortgage Type
New Conventional
Create a Home Valuation Report for This Property
The Home Valuation Report is an in-depth analysis detailing your home's value as well as a comparison with similar homes in the area
Home Values in the Area
Average Home Value in this Area
Purchase History
| Date | Buyer | Sale Price | Title Company |
|---|---|---|---|
| Kirar Michael | $235,000 | -- | |
| Troutman Kevin W | $260,000 | -- | |
| Hebert David | $256,300 | -- |
Source: Public Records
Mortgage History
| Date | Status | Borrower | Loan Amount |
|---|---|---|---|
| Previous Owner | Kirar Michael | $227,000 | |
| Previous Owner | Troutman Kevin W | $208,000 | |
| Previous Owner | Hebert David | $204,950 |
Source: Public Records
Tax History Compared to Growth
Tax History
| Year | Tax Paid | Tax Assessment Tax Assessment Total Assessment is a certain percentage of the fair market value that is determined by local assessors to be the total taxable value of land and additions on the property. | Land | Improvement |
|---|---|---|---|---|
| 2025 | $4,852 | $188,064 | $26,000 | $162,064 |
| 2024 | $4,856 | $188,064 | $26,000 | $162,064 |
| 2023 | $4,313 | $188,064 | $26,000 | $162,064 |
| 2022 | $3,759 | $136,328 | $26,000 | $110,328 |
| 2021 | $3,759 | $136,328 | $26,000 | $110,328 |
| 2020 | $3,759 | $136,328 | $26,000 | $110,328 |
| 2019 | $3,487 | $123,908 | $24,000 | $99,908 |
| 2018 | $3,761 | $123,908 | $24,000 | $99,908 |
| 2017 | $3,067 | $106,688 | $24,000 | $82,688 |
| 2016 | $3,067 | $106,688 | $24,000 | $82,688 |
| 2015 | $2,717 | $92,232 | $25,200 | $67,032 |
| 2014 | $2,740 | $92,232 | $0 | $0 |
Source: Public Records
Map
Nearby Homes
- 4392 Paces Point Cir SE
- 4428 Wilkerson Manor Dr SE Unit 6
- 4430 Wilkerson Manor Dr SE
- 4289 Laurel Creek Ct SE Unit 10
- 4266 Cabretta Dr SE
- 4350 Oakdale Vinings Cir SE
- 4287 Cabretta Dr SE
- 4492 Oakdale Rd SE
- 1910 Cooper Landing Dr SE
- 1914 Cooper Landing Dr SE
- 4343 Ivy Glen Ct SE
- 2015 Chelton Way SE
- 2011 Chelton Way SE
- 2111 Iverson Dr SE
- 2207 Iron Gate Dr SE
- 4471 Redan Ct
- 4394 Paces Point Cir SE Unit 4394
- 4394 Paces Point Cir SE
- 4390 Paces Point Cir SE
- 4394 Paces Point Cir SE
- 4398 Paces Point Cir SE
- 4402 Paces Point Cir SE
- 4400 Paces Point Cir SE Unit 2
- 4394 Paces Point Cir SE
- 4396 Paces Point Cir SE
- 4394 Paces Point Cir
- 4360 Paces Park
- 4356 Paces Point Cir SE Unit 4356
- 4356 Paces Point Cir SE Unit 111
- 4356 Paces Point Cir SE
- 4358 Paces Point Cir SE
- 4366 Paces Point Cir SE
- 4368 Paces Point Cir SE
- 4360 Paces Point Cir SE Unit III
- 4354 Paces Point Cir SE
- 4360 Paces Point Cir SE Unit 3