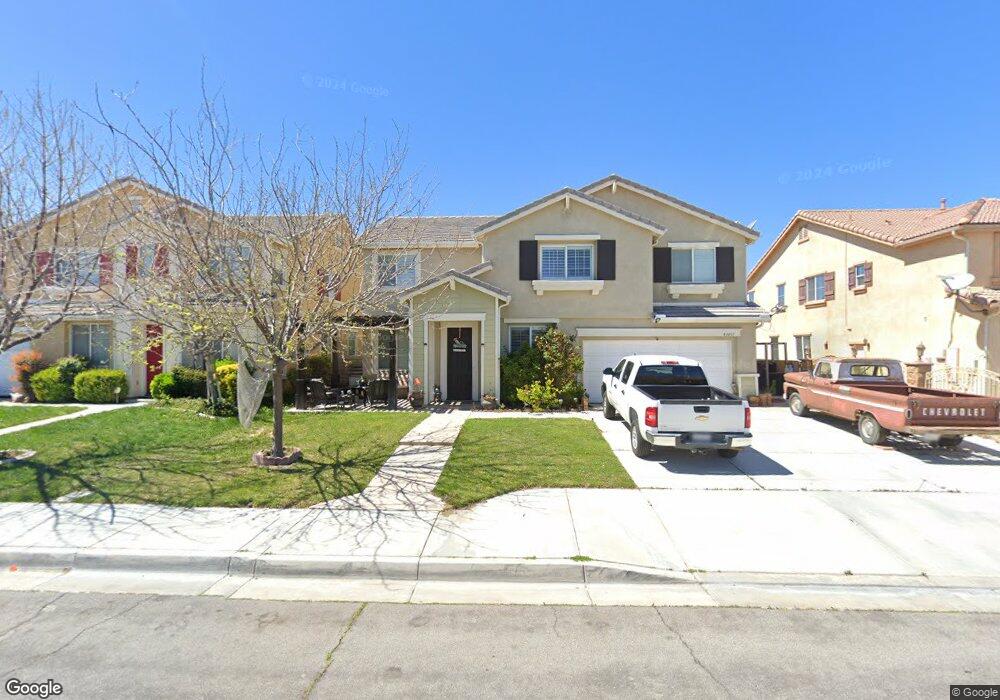
43891 Spring St Lancaster, CA 93536
West Lancaster NeighborhoodEstimated Value: $559,451 - $622,000
5
Beds
3
Baths
2,755
Sq Ft
$216/Sq Ft
Est. Value
About This Home
This home is located at 43891 Spring St, Lancaster, CA 93536 and is currently estimated at $594,113, approximately $215 per square foot. 43891 Spring St is a home located in Los Angeles County with nearby schools including West Wind Elementary School, Endeavour Middle School, and Lancaster High School.
Ownership History
Date
Name
Owned For
Owner Type
Purchase Details
Closed on
Dec 24, 2013
Sold by
Montes Federico
Bought by
Montes Luis H and Cantoran Thania Lopez
Current Estimated Value
Home Financials for this Owner
Home Financials are based on the most recent Mortgage that was taken out on this home.
Original Mortgage
$207,570
Outstanding Balance
$149,407
Interest Rate
3.3%
Mortgage Type
FHA
Estimated Equity
$444,706
Purchase Details
Closed on
Jul 18, 2011
Sold by
Montes Federico and Montes Victoria
Bought by
Montes Federico and Montes Victoria
Purchase Details
Closed on
Dec 22, 2010
Sold by
Dhintec Inc
Bought by
Montes Federico and Montes Victoria
Home Financials for this Owner
Home Financials are based on the most recent Mortgage that was taken out on this home.
Original Mortgage
$179,200
Interest Rate
4.82%
Mortgage Type
New Conventional
Purchase Details
Closed on
Jun 22, 2010
Sold by
Miessner Mark
Bought by
Dhintec Inc
Purchase Details
Closed on
Mar 20, 2007
Sold by
Avone Homes Llc
Bought by
Miessner Mark
Home Financials for this Owner
Home Financials are based on the most recent Mortgage that was taken out on this home.
Original Mortgage
$312,000
Interest Rate
6.1%
Mortgage Type
Purchase Money Mortgage
Create a Home Valuation Report for This Property
The Home Valuation Report is an in-depth analysis detailing your home's value as well as a comparison with similar homes in the area
Home Values in the Area
Average Home Value in this Area
Purchase History
| Date | Buyer | Sale Price | Title Company |
|---|---|---|---|
| Montes Luis H | -- | Act | |
| Montes Federico | -- | None Available | |
| Montes Federico | $224,000 | Chicago Title Company | |
| Dhintec Inc | -- | None Available | |
| Miessner Mark | $390,000 | Fidelity Natl Title Ins Co |
Source: Public Records
Mortgage History
| Date | Status | Borrower | Loan Amount |
|---|---|---|---|
| Open | Montes Luis H | $207,570 | |
| Closed | Montes Federico | $179,200 | |
| Previous Owner | Miessner Mark | $312,000 |
Source: Public Records
Tax History
| Year | Tax Paid | Tax Assessment Tax Assessment Total Assessment is a certain percentage of the fair market value that is determined by local assessors to be the total taxable value of land and additions on the property. | Land | Improvement |
|---|---|---|---|---|
| 2025 | $6,867 | $335,875 | $83,966 | $251,909 |
| 2024 | $6,867 | $329,290 | $82,320 | $246,970 |
| 2023 | $6,728 | $322,834 | $80,706 | $242,128 |
| 2022 | $6,473 | $316,505 | $79,124 | $237,381 |
| 2021 | $6,028 | $310,300 | $77,573 | $232,727 |
| 2019 | $5,843 | $301,098 | $75,273 | $225,825 |
| 2018 | $5,738 | $295,196 | $73,798 | $221,398 |
| 2016 | $5,441 | $283,734 | $70,933 | $212,801 |
| 2015 | $5,363 | $279,473 | $69,868 | $209,605 |
| 2014 | $4,829 | $234,105 | $46,820 | $187,285 |
Source: Public Records
Map
Nearby Homes
- 43890 Moccasin Place
- 43929 44th St W
- 43936 Catsue Place
- 4244 Jonathon St
- 43705 46th St W
- 4225 Vahan Ct
- 43711 47th St W
- 0 47th St W
- 44130 Catsue Place
- 4660 Spice St
- 4776 W Avenue j5
- 43521 Blossom Dr
- 0 47th Stw Vic Ave K2 Unit 26001095
- 44128 Westridge Dr
- 44302 Marbella St
- 44328 47th St W
- 44340 46th St W
- 44329 47th St W
- 3832 W Avenue j11
- 4629 Jade Ct
- 43903 Spring St
- 43885 Spring St
- 43890 Firewood Way
- 43875 Spring St
- 43909 Spring St
- 43904 Firewood Way
- 43884 Firewood Way
- 43874 Firewood Way
- 43910 Firewood Way
- 43865 Spring St
- 43917 Spring St
- 43902 Spring St
- 43884 Spring St
- 43910 Spring St
- 43864 Firewood Way
- 43916 Firewood Way
- 43874 Spring St
- 43855 Spring St
- 43923 Spring St
- 43916 Spring St
Your Personal Tour Guide
Ask me questions while you tour the home.