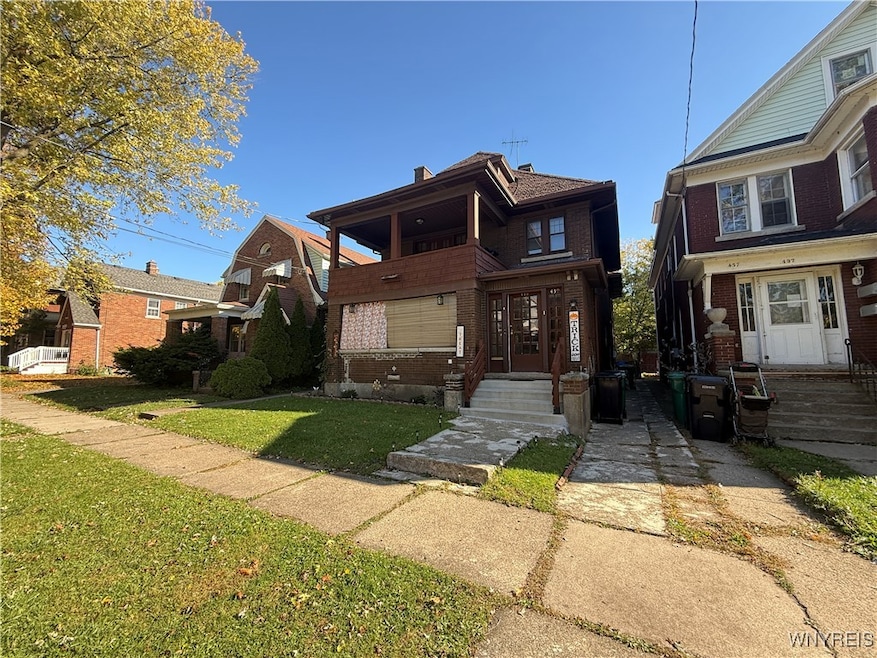
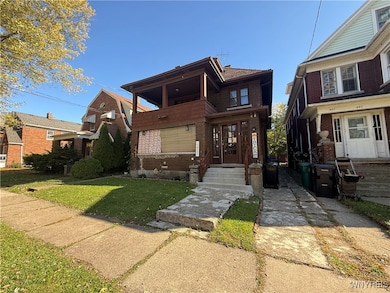
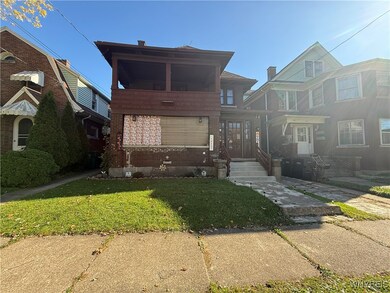
439 13th St Niagara Falls, NY 14303
East Side NeighborhoodEstimated payment $733/month
Highlights
- Property is near public transit
- Forced Air Heating System
- Rectangular Lot
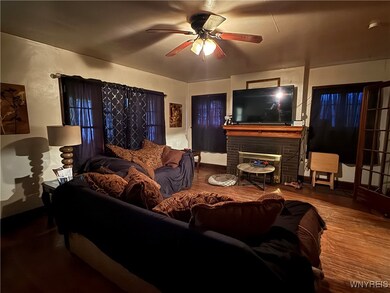
- Wood Flooring
- Laundry Facilities
- Property is Fully Fenced
About This Home
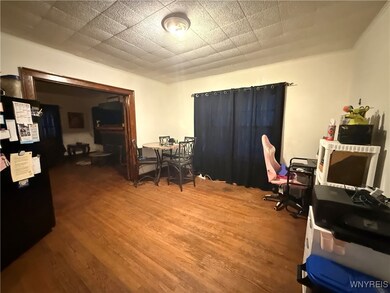
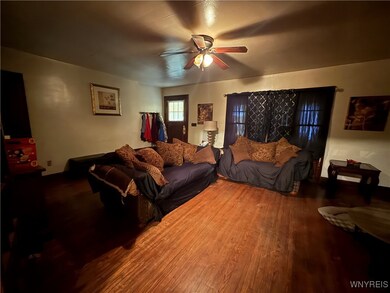
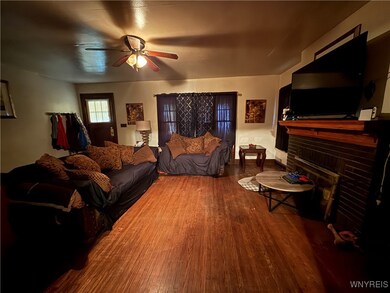
Welcome to 439 13th Street, perfect for owner occupancy or investors seeking a promising opportunity in Niagara Falls. This solid brick 3/3 double offers a total rental income of $1,655, with each unit featuring one bath, spacious living and dining areas, and elegant hardwood floors. Relax and enjoy the top porch or the privacy of a fenced-in yard, ideal for outdoor activities. The property boasts solid mechanics and updated electrical systems, ensuring reliability and peace of mind. Situated near public transportation and shopping, this home provides convenient access to all essential amenities. Whether you're looking to invest or find a home for yourself, 439 13th Street presents a versatile opportunity in a vibrant community. Explore the possibilities today! Seller will provide the existing survey with an affidavit of no change and a 40-year search on the note.
Listing Agent
Listing by WNY Metro Roberts Realty Brokerage Phone: 7164302091 License #10301217766 Listed on: 11/03/2025

Property Details
Home Type
- Multi-Family
Est. Annual Taxes
- $1,247
Year Built
- Built in 1920
Lot Details
- 3,795 Sq Ft Lot
- Lot Dimensions are 33x115
- Property is Fully Fenced
- Rectangular Lot
Home Design
- Brick Exterior Construction
- Stone Foundation
Interior Spaces
- 3,040 Sq Ft Home
- 2-Story Property
- Wood Flooring
- Partial Basement
Bedrooms and Bathrooms
- 6 Bedrooms
- 2 Full Bathrooms
Location
- Property is near public transit
Utilities
- Forced Air Heating System
- Heating System Uses Gas
- Gas Water Heater
Listing and Financial Details
- Tax Lot 41
- Assessor Parcel Number 291100-159-031-0003-041-000
Community Details
Overview
- 2 Units
- Mile Reserve Subdivision
Additional Features
- Laundry Facilities
- 2 Separate Gas Meters
Map
Home Values in the Area
Average Home Value in this Area
Tax History
| Year | Tax Paid | Tax Assessment Tax Assessment Total Assessment is a certain percentage of the fair market value that is determined by local assessors to be the total taxable value of land and additions on the property. | Land | Improvement |
|---|---|---|---|---|
| 2024 | $2,401 | $40,900 | $1,900 | $39,000 |
| 2023 | $1,963 | $40,900 | $1,900 | $39,000 |
| 2022 | $1,196 | $40,900 | $1,900 | $39,000 |
| 2021 | $1,196 | $40,900 | $1,900 | $39,000 |
| 2020 | $794 | $40,900 | $1,900 | $39,000 |
| 2019 | $762 | $40,900 | $1,900 | $39,000 |
| 2018 | $1,175 | $40,900 | $1,900 | $39,000 |
| 2017 | $762 | $40,900 | $1,900 | $39,000 |
| 2016 | $1,143 | $40,900 | $1,900 | $39,000 |
| 2015 | -- | $40,900 | $1,900 | $39,000 |
| 2014 | -- | $40,900 | $1,900 | $39,000 |
Property History
| Date | Event | Price | List to Sale | Price per Sq Ft |
|---|---|---|---|---|
| 11/16/2025 11/16/25 | Pending | -- | -- | -- |
| 11/11/2025 11/11/25 | Price Changed | $119,900 | -11.1% | $39 / Sq Ft |
| 11/03/2025 11/03/25 | For Sale | $134,900 | -- | $44 / Sq Ft |
Purchase History
| Date | Type | Sale Price | Title Company |
|---|---|---|---|
| Deed | -- | Rebecca Monte | |
| Deed | $43,500 | -- | |
| Deed | $23,000 | Puleo & Puleo | |
| Deed | $43,000 | Shari Lazarus |
Source: Western New York Real Estate Information Services (WNYREIS)
MLS Number: B1648540
APN: 291100-159-031-0003-041-000
Disclaimer: Certain information contained herein is derived from information provided by parties other than Homes.com. All information provided is deemed reliable, but is not guaranteed to be accurate and should be independently verified.
![]() The data relating to real estate on this web site comes in part from the Internet Data Exchange (IDX) Program of the CNYIS, UNYREIS and WNYREIS. Real estate listings held by firms other than Homes.com, LLC are marked with the IDX logo and include the Listing Broker’s Firm Name.
The data relating to real estate on this web site comes in part from the Internet Data Exchange (IDX) Program of the CNYIS, UNYREIS and WNYREIS. Real estate listings held by firms other than Homes.com, LLC are marked with the IDX logo and include the Listing Broker’s Firm Name.
Disclaimer: All information deemed reliable but not guaranteed and should be independently verified. All properties
are subject to prior sale, change or withdrawal. Neither the listing broker(s) nor Homes.com, LLC shall be responsible for any typographical errors, misinformation, misprints, and shall be held totally harmless.
© 2025 CNYIS, UNYREIS, WNYREIS. All rights reserved.