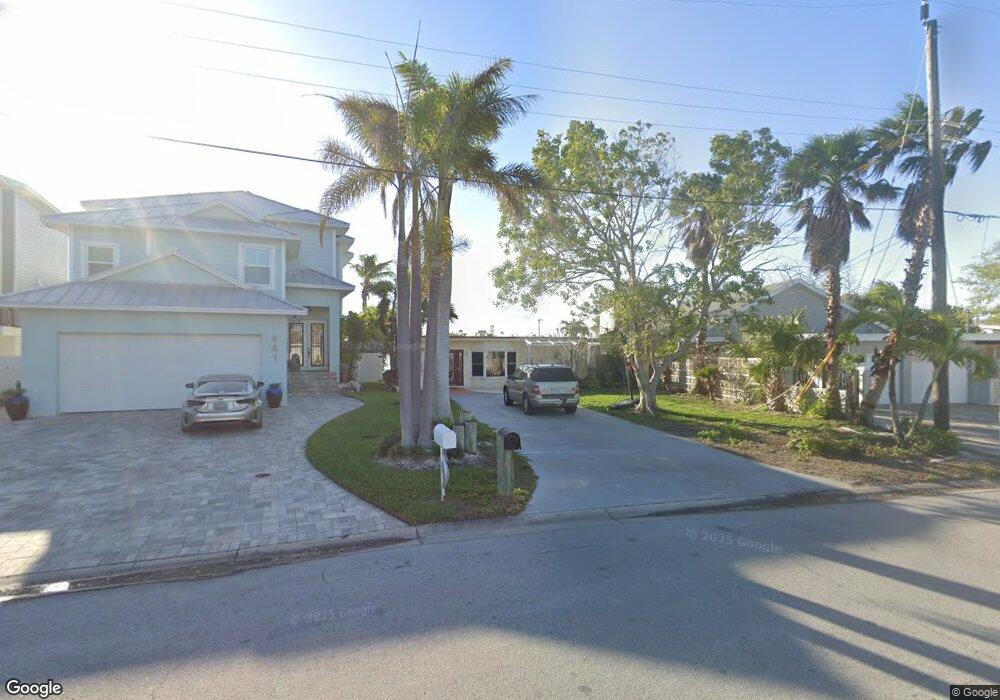
439 18th Ave Indian Rocks Beach, FL 33785
Estimated Value: $889,516 - $1,358,000
--
Bed
--
Bath
2,065
Sq Ft
$542/Sq Ft
Est. Value
About This Home
This home is located at 439 18th Ave, Indian Rocks Beach, FL 33785 and is currently estimated at $1,119,129, approximately $541 per square foot. 439 18th Ave is a home with nearby schools including Anona Elementary School, Largo High School, and Seminole Middle School.
Ownership History
Date
Name
Owned For
Owner Type
Purchase Details
Closed on
Oct 2, 2002
Sold by
Shahul John and Shahul Fathima
Bought by
Shahul John and Shahul Fathima
Current Estimated Value
Home Financials for this Owner
Home Financials are based on the most recent Mortgage that was taken out on this home.
Original Mortgage
$122,700
Outstanding Balance
$51,854
Interest Rate
6.27%
Mortgage Type
Credit Line Revolving
Estimated Equity
$1,067,275
Purchase Details
Closed on
Oct 9, 2000
Sold by
Sampson Henry A and Sampson Mary L
Bought by
Shahul Mahaboob J and Shahul Fathima
Purchase Details
Closed on
Jan 17, 1995
Sold by
Arden Robert B and Arden Irene B
Bought by
Sampson Henry A and Sampson Mary L
Create a Home Valuation Report for This Property
The Home Valuation Report is an in-depth analysis detailing your home's value as well as a comparison with similar homes in the area
Home Values in the Area
Average Home Value in this Area
Purchase History
| Date | Buyer | Sale Price | Title Company |
|---|---|---|---|
| Shahul John | -- | -- | |
| Shahul Mahaboob J | $312,500 | -- | |
| Sampson Henry A | $165,000 | -- |
Source: Public Records
Mortgage History
| Date | Status | Borrower | Loan Amount |
|---|---|---|---|
| Open | Shahul Mahaboob J | $122,700 | |
| Closed | Shahul Mahaboob J | $122,700 | |
| Previous Owner | Shahul Mahaboob J | $300,700 | |
| Closed | Shahul Mahaboob J | $0 | |
| Closed | Shahul Mahaboob J | $31,250 |
Source: Public Records
Tax History Compared to Growth
Tax History
| Year | Tax Paid | Tax Assessment Tax Assessment Total Assessment is a certain percentage of the fair market value that is determined by local assessors to be the total taxable value of land and additions on the property. | Land | Improvement |
|---|---|---|---|---|
| 2024 | $5,235 | $359,823 | -- | -- |
| 2023 | $5,235 | $349,343 | $0 | $0 |
| 2022 | $4,945 | $339,168 | $0 | $0 |
| 2021 | $5,042 | $329,289 | $0 | $0 |
| 2020 | $5,044 | $324,743 | $0 | $0 |
| 2019 | $4,973 | $317,442 | $0 | $0 |
| 2018 | $4,820 | $311,523 | $0 | $0 |
| 2017 | $4,821 | $305,116 | $0 | $0 |
| 2016 | $4,797 | $298,840 | $0 | $0 |
| 2015 | $4,900 | $296,763 | $0 | $0 |
| 2014 | -- | $294,408 | $0 | $0 |
Source: Public Records
Map
Nearby Homes