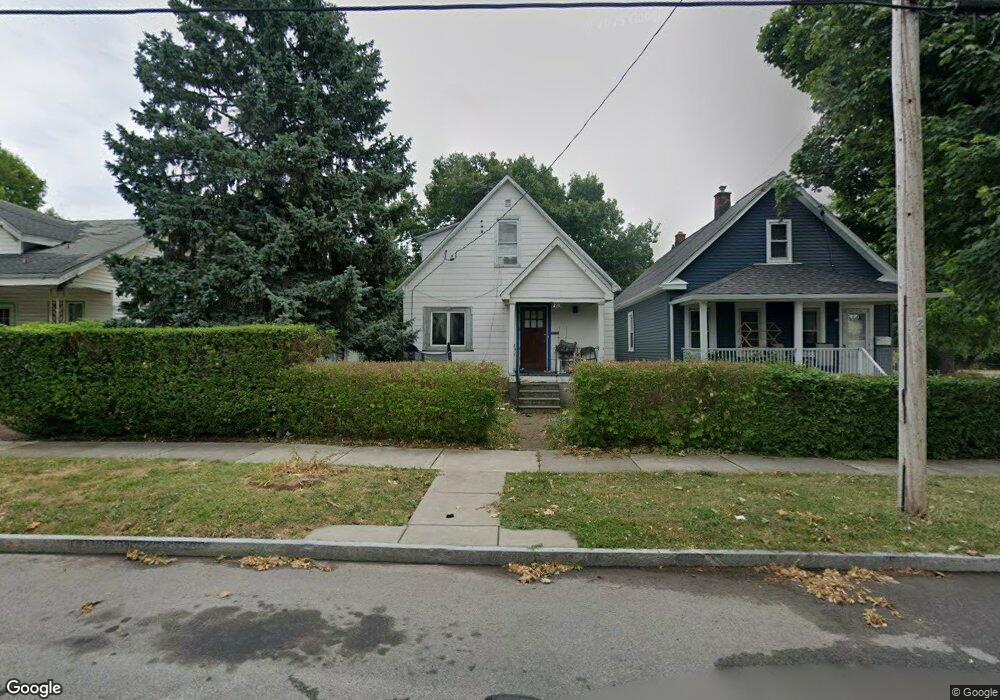
439 27th St Niagara Falls, NY 14303
South End NeighborhoodEstimated Value: $66,000 - $101,000
1
Bed
1
Bath
1,184
Sq Ft
$69/Sq Ft
Est. Value
About This Home
This home is located at 439 27th St, Niagara Falls, NY 14303 and is currently estimated at $82,000, approximately $69 per square foot. 439 27th St is a home located in Niagara County with nearby schools including Niagara Falls High School and St. Joseph Elementary School.
Ownership History
Date
Name
Owned For
Owner Type
Purchase Details
Closed on
Jul 3, 2024
Sold by
Doran Frank
Bought by
Zevi Llc
Current Estimated Value
Home Financials for this Owner
Home Financials are based on the most recent Mortgage that was taken out on this home.
Original Mortgage
$709,600
Outstanding Balance
$701,189
Interest Rate
7.03%
Mortgage Type
New Conventional
Estimated Equity
-$619,189
Purchase Details
Closed on
Sep 20, 2004
Sold by
Lu Kowal Kathryn
Bought by
Doran Frank
Create a Home Valuation Report for This Property
The Home Valuation Report is an in-depth analysis detailing your home's value as well as a comparison with similar homes in the area
Home Values in the Area
Average Home Value in this Area
Purchase History
| Date | Buyer | Sale Price | Title Company |
|---|---|---|---|
| Zevi Llc | $950,000 | None Listed On Document | |
| Doran Frank | $15,000 | James Faso |
Source: Public Records
Mortgage History
| Date | Status | Borrower | Loan Amount |
|---|---|---|---|
| Open | Zevi Llc | $709,600 |
Source: Public Records
Tax History Compared to Growth
Tax History
| Year | Tax Paid | Tax Assessment Tax Assessment Total Assessment is a certain percentage of the fair market value that is determined by local assessors to be the total taxable value of land and additions on the property. | Land | Improvement |
|---|---|---|---|---|
| 2024 | $2,320 | $33,000 | $2,100 | $30,900 |
| 2023 | $1,394 | $33,000 | $2,100 | $30,900 |
| 2022 | $965 | $33,000 | $2,100 | $30,900 |
| 2021 | $965 | $33,000 | $2,100 | $30,900 |
| 2020 | $640 | $33,000 | $2,100 | $30,900 |
| 2019 | $615 | $33,000 | $2,100 | $30,900 |
| 2018 | $948 | $33,000 | $2,100 | $30,900 |
| 2017 | $615 | $33,000 | $2,100 | $30,900 |
| 2016 | $922 | $33,000 | $2,100 | $30,900 |
| 2015 | -- | $33,000 | $2,100 | $30,900 |
| 2014 | -- | $33,000 | $2,100 | $30,900 |
Source: Public Records
Map
Nearby Homes