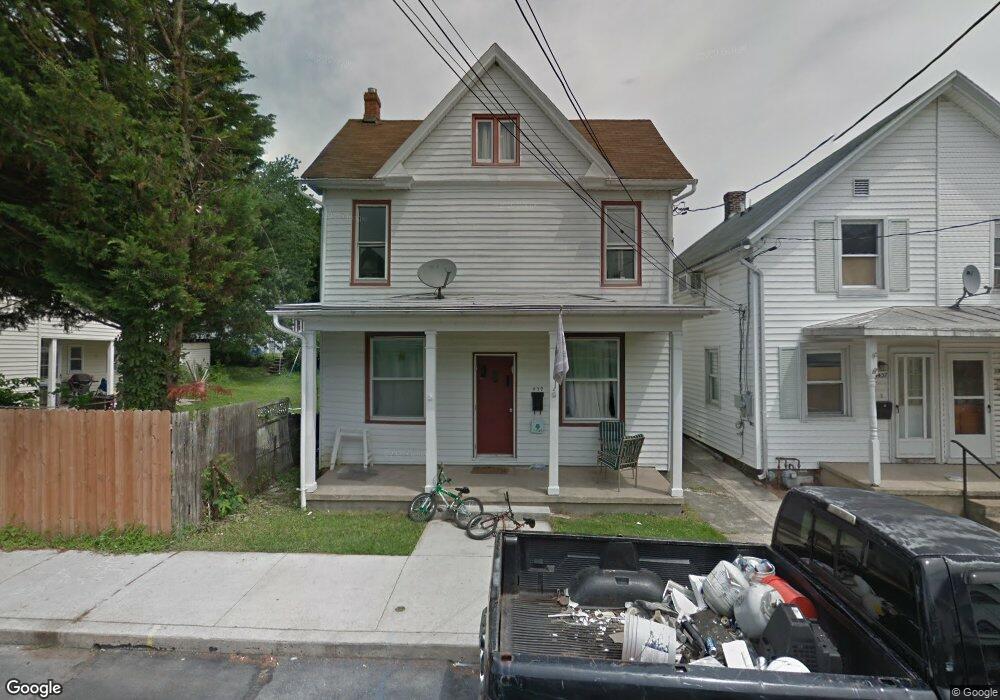
439 3rd St Enola, PA 17025
East Pennsboro NeighborhoodEstimated Value: $122,000 - $207,000
3
Beds
2
Baths
1,302
Sq Ft
$139/Sq Ft
Est. Value
About This Home
This home is located at 439 3rd St, Enola, PA 17025 and is currently estimated at $181,451, approximately $139 per square foot. 439 3rd St is a home located in Cumberland County with nearby schools including East Pennsboro Area Middle School, East Pennsboro Area Senior High School, and Harrisburg Academy.
Ownership History
Date
Name
Owned For
Owner Type
Purchase Details
Closed on
Jun 11, 2013
Sold by
Sec Of Hud Of Washington Dc
Bought by
Finnegan Dianne and Visser Carolyn M
Current Estimated Value
Home Financials for this Owner
Home Financials are based on the most recent Mortgage that was taken out on this home.
Original Mortgage
$55,148
Outstanding Balance
$39,455
Interest Rate
3.62%
Mortgage Type
FHA
Estimated Equity
$141,996
Purchase Details
Closed on
Sep 7, 2011
Sold by
Anderson Sheriff Ronny R and Boyer Michael C
Bought by
Wells Fargo Bank
Purchase Details
Closed on
Aug 27, 2008
Sold by
Shaull Herbert L
Bought by
Boyer Michael C
Home Financials for this Owner
Home Financials are based on the most recent Mortgage that was taken out on this home.
Original Mortgage
$113,403
Interest Rate
6.69%
Mortgage Type
FHA
Create a Home Valuation Report for This Property
The Home Valuation Report is an in-depth analysis detailing your home's value as well as a comparison with similar homes in the area
Home Values in the Area
Average Home Value in this Area
Purchase History
| Date | Buyer | Sale Price | Title Company |
|---|---|---|---|
| Finnegan Dianne | $59,000 | -- | |
| Wells Fargo Bank | -- | -- | |
| Boyer Michael C | $114,900 | -- |
Source: Public Records
Mortgage History
| Date | Status | Borrower | Loan Amount |
|---|---|---|---|
| Open | Finnegan Dianne | $55,148 | |
| Previous Owner | Boyer Michael C | $113,403 |
Source: Public Records
Tax History Compared to Growth
Tax History
| Year | Tax Paid | Tax Assessment Tax Assessment Total Assessment is a certain percentage of the fair market value that is determined by local assessors to be the total taxable value of land and additions on the property. | Land | Improvement |
|---|---|---|---|---|
| 2025 | $2,308 | $111,800 | $17,200 | $94,600 |
| 2024 | $2,177 | $111,800 | $17,200 | $94,600 |
| 2023 | $2,054 | $111,800 | $17,200 | $94,600 |
| 2022 | $1,931 | $111,800 | $17,200 | $94,600 |
| 2021 | $1,898 | $111,800 | $17,200 | $94,600 |
| 2020 | $14,310 | $111,800 | $17,200 | $94,600 |
| 2019 | $1,831 | $111,800 | $17,200 | $94,600 |
| 2018 | $1,811 | $111,800 | $17,200 | $94,600 |
| 2017 | -- | $111,800 | $17,200 | $94,600 |
| 2016 | -- | $111,800 | $17,200 | $94,600 |
| 2015 | -- | $111,800 | $17,200 | $94,600 |
| 2014 | -- | $111,800 | $17,200 | $94,600 |
Source: Public Records
Map
Nearby Homes
- 1445 2nd St
- 418 State St
- 217 Clay St
- 1123 2nd St
- 497 State St
- 1609 High St
- 25 Creekside Dr
- 18 B W Glenwood Dr
- 403 S Enola Dr
- 3 Woods Dr
- 1068 W Foxcroft Dr
- 333 Briar Ridge Cir
- 221 W Locust St
- 510 Echo Rd
- 120 S Enola Dr
- 115 S Enola Dr
- 920 W Foxcroft Dr
- 2304 N 2nd St
- 11 W Highland Ave
- 2309 1/2 N 2nd St