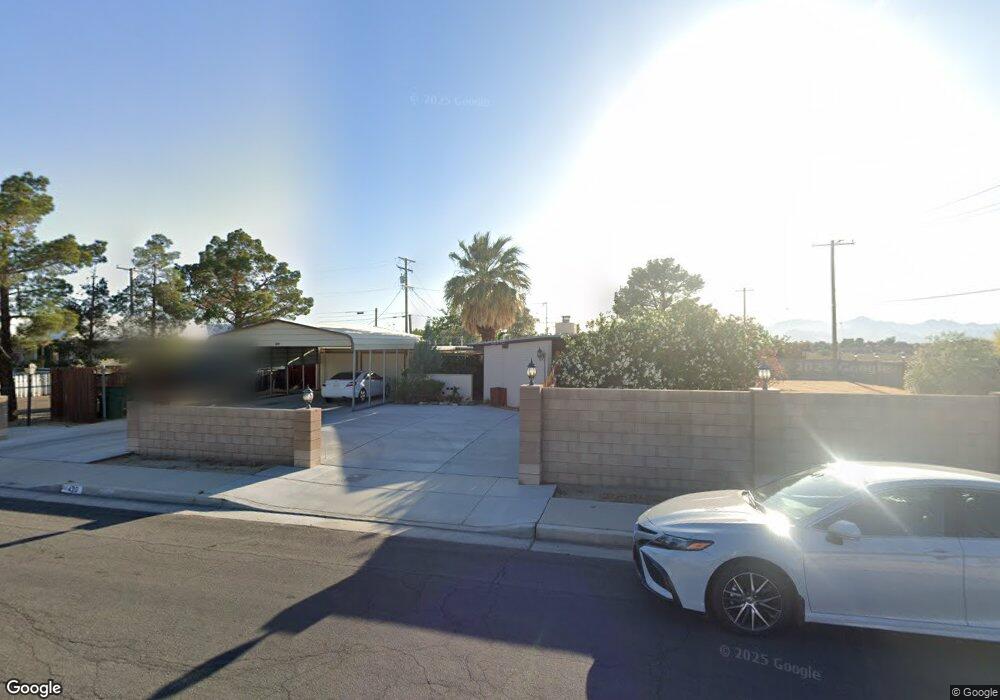
439 Balsam St Ridgecrest, CA 93555
Estimated Value: $184,866 - $238,000
2
Beds
3
Baths
1,756
Sq Ft
$119/Sq Ft
Est. Value
About This Home
This home is located at 439 Balsam St, Ridgecrest, CA 93555 and is currently estimated at $208,217, approximately $118 per square foot. 439 Balsam St is a home located in Kern County with nearby schools including Las Flores Elementary School, James Monroe Middle School, and Burroughs High School.
Ownership History
Date
Name
Owned For
Owner Type
Purchase Details
Closed on
Nov 24, 2008
Sold by
Benson Marianne F
Bought by
Benson Marianne F and Marianne F Benson 2008 Trust
Current Estimated Value
Purchase Details
Closed on
Feb 7, 1997
Sold by
Hud
Bought by
Benson Eugene W and Benson Marianne F
Home Financials for this Owner
Home Financials are based on the most recent Mortgage that was taken out on this home.
Original Mortgage
$30,450
Outstanding Balance
$3,536
Interest Rate
7.86%
Estimated Equity
$204,681
Purchase Details
Closed on
Mar 7, 1996
Sold by
Fleet Mtg Corp
Bought by
Hud
Purchase Details
Closed on
Feb 1, 1996
Sold by
Laracuente A David and Laracuente Katherine E
Bought by
Fleet Mtg Corp and Fleet Real Estate Funding
Purchase Details
Closed on
Apr 28, 1995
Sold by
Kunz Kenneth M
Bought by
Kunz Kenneth M and Dunham Millie A
Create a Home Valuation Report for This Property
The Home Valuation Report is an in-depth analysis detailing your home's value as well as a comparison with similar homes in the area
Home Values in the Area
Average Home Value in this Area
Purchase History
| Date | Buyer | Sale Price | Title Company |
|---|---|---|---|
| Benson Marianne F | -- | None Available | |
| Benson Marianne F | -- | None Available | |
| Benson Eugene W | $38,500 | American Title Co | |
| Hud | $70,938 | Nations Title | |
| Fleet Mtg Corp | $70,938 | United Title Company | |
| Kunz Kenneth M | -- | -- |
Source: Public Records
Mortgage History
| Date | Status | Borrower | Loan Amount |
|---|---|---|---|
| Open | Benson Eugene W | $30,450 |
Source: Public Records
Tax History Compared to Growth
Tax History
| Year | Tax Paid | Tax Assessment Tax Assessment Total Assessment is a certain percentage of the fair market value that is determined by local assessors to be the total taxable value of land and additions on the property. | Land | Improvement |
|---|---|---|---|---|
| 2025 | $1,150 | $62,017 | $9,754 | $52,263 |
| 2024 | $1,121 | $60,802 | $9,563 | $51,239 |
| 2023 | $1,121 | $59,611 | $9,376 | $50,235 |
| 2022 | $1,097 | $58,443 | $9,193 | $49,250 |
| 2021 | $1,035 | $57,298 | $9,013 | $48,285 |
| 2020 | $1,003 | $56,711 | $8,921 | $47,790 |
| 2019 | $990 | $56,711 | $8,921 | $47,790 |
| 2018 | $977 | $54,511 | $8,576 | $45,935 |
| 2017 | $974 | $53,443 | $8,408 | $45,035 |
| 2016 | $939 | $52,396 | $8,244 | $44,152 |
| 2015 | $922 | $51,610 | $8,121 | $43,489 |
| 2014 | $805 | $50,600 | $7,962 | $42,638 |
Source: Public Records
Map
Nearby Homes
- 432 N Warner St
- 408 N Warner St
- 309 N Fairview St
- 233 N Fairview St
- 320 N Helena St
- 304 N Helena St
- 308 W Felspar Ave
- 729 N Sanders St
- 225 W French Ave
- 241 W French Ave
- 233 N Alvord St
- 333 N Florence St
- 225 N Alvord St
- 417 Argus Ave
- 304 Panamint Ave
- 308 Panamint Ave
- 224 N Florence St
- 304 Palm Dr Unit G
- 526 W Las Flores Ave
- 0 Ridgecrest Blvd Unit 2607074
- 429 Balsam St
- 436 N Sanders St
- 428 N Sanders St
- 427 Balsam St
- 436 Balsam St
- 424 N Sanders St
- 428 Balsam St
- 421 Balsam St
- 424 Balsam St
- 420 N Sanders St
- 419 Balsam St
- 422 Balsam St
- 437 N Sanders St
- 429 N Sanders St Unit A
- 0 Balsam St (Apn: 067-126-07)
- 416 Balsam St
- 425 N Sanders St
- 421 N Sanders St
- 408 N Sanders St
- 411 Balsam St