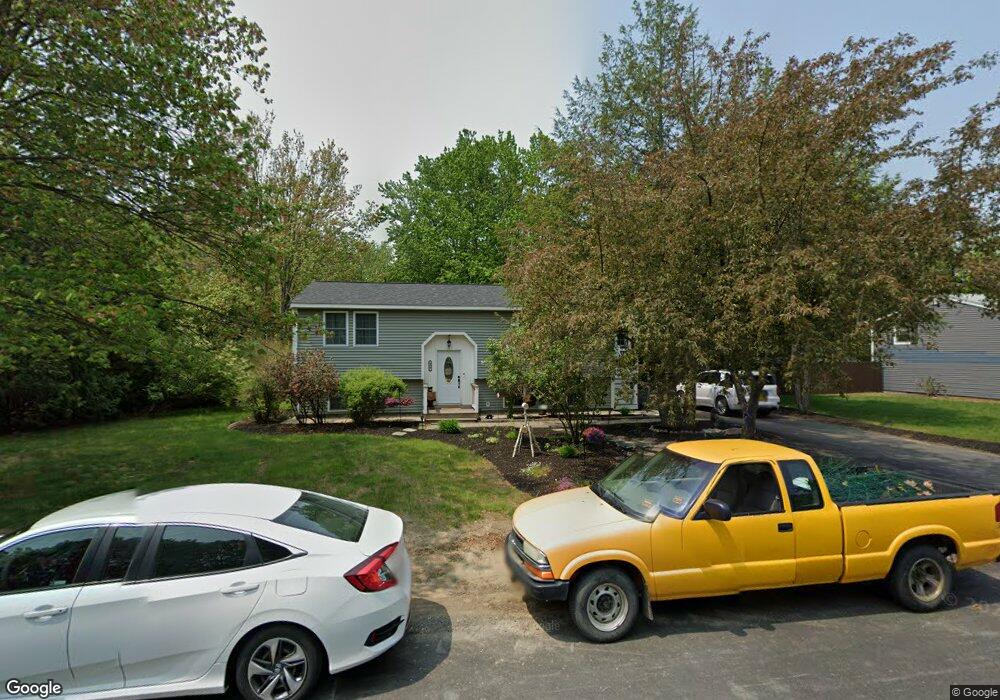
439 Beccaris Dr Rollinsford, NH 03869
Estimated Value: $444,000 - $565,000
4
Beds
2
Baths
1,478
Sq Ft
$326/Sq Ft
Est. Value
About This Home
This home is located at 439 Beccaris Dr, Rollinsford, NH 03869 and is currently estimated at $482,011, approximately $326 per square foot. 439 Beccaris Dr is a home located in Strafford County with nearby schools including Rollinsford Grade School, Berwick Academy, and Seacoast Christian School.
Ownership History
Date
Name
Owned For
Owner Type
Purchase Details
Closed on
Dec 12, 2023
Sold by
Pike Dan E and Pike Stefany M
Bought by
Stefany & Dan Pike Lt and Pike
Current Estimated Value
Purchase Details
Closed on
May 24, 2021
Sold by
Pike Stefany M
Bought by
Pike Dan E and Pike Stefany M
Home Financials for this Owner
Home Financials are based on the most recent Mortgage that was taken out on this home.
Original Mortgage
$88,600
Interest Rate
2.9%
Mortgage Type
Stand Alone Refi Refinance Of Original Loan
Purchase Details
Closed on
Apr 2, 2001
Sold by
Emerson Kathleen A and Emerson George W
Bought by
King Stefany M
Home Financials for this Owner
Home Financials are based on the most recent Mortgage that was taken out on this home.
Original Mortgage
$101,000
Interest Rate
6.96%
Mortgage Type
Purchase Money Mortgage
Create a Home Valuation Report for This Property
The Home Valuation Report is an in-depth analysis detailing your home's value as well as a comparison with similar homes in the area
Home Values in the Area
Average Home Value in this Area
Purchase History
| Date | Buyer | Sale Price | Title Company |
|---|---|---|---|
| Stefany & Dan Pike Lt | -- | None Available | |
| Stefany & Dan Pike Lt | -- | None Available | |
| Pike Dan E | -- | None Available | |
| Pike Dan E | -- | None Available | |
| King Stefany M | $141,000 | -- | |
| King Stefany M | $141,000 | -- |
Source: Public Records
Mortgage History
| Date | Status | Borrower | Loan Amount |
|---|---|---|---|
| Previous Owner | Pike Dan E | $88,600 | |
| Previous Owner | King Stefany M | $60,000 | |
| Previous Owner | King Stefany M | $101,000 |
Source: Public Records
Tax History Compared to Growth
Tax History
| Year | Tax Paid | Tax Assessment Tax Assessment Total Assessment is a certain percentage of the fair market value that is determined by local assessors to be the total taxable value of land and additions on the property. | Land | Improvement |
|---|---|---|---|---|
| 2024 | $5,977 | $364,200 | $182,300 | $181,900 |
| 2023 | $5,601 | $364,200 | $182,300 | $181,900 |
| 2022 | $5,416 | $364,200 | $182,300 | $181,900 |
| 2021 | $5,220 | $214,100 | $108,200 | $105,900 |
| 2020 | $5,284 | $214,100 | $108,200 | $105,900 |
| 2019 | $4,841 | $214,100 | $108,200 | $105,900 |
| 2018 | $5,183 | $214,100 | $108,200 | $105,900 |
| 2016 | $4,586 | $163,900 | $66,800 | $97,100 |
| 2015 | $4,496 | $163,900 | $66,800 | $97,100 |
| 2014 | $4,343 | $163,900 | $66,800 | $97,100 |
| 2013 | $4,406 | $163,900 | $66,800 | $97,100 |
Source: Public Records
Map
Nearby Homes
- 442 Prospect St
- 26 Stevens Ct
- 37 Nealley St
- 24 Spillanes Hill
- 72 Moses Carr Rd
- 289 Main St
- 10 Portland St
- 23 Paul St
- 72 Vine St
- 10 Hill Dr
- 3 Bennett St
- 10 Turgeon's Ln
- 17 2nd St
- 24 Farmgate Rd
- 29 Buffumsville Rd
- 11 Country Club Estates Dr Unit 11
- 22 High Knoll Dr
- 13 Beaver Dam Rd
- Lot 6 Emerson Ridge Unit 6
- 14 Central St
- 443 Beccaris Dr
- 435 Beccaris Dr
- 447 Beccaris Dr
- 431 Beccaris Dr
- 440 Beccaris Dr
- 436 Beccaris Dr
- 432 Beccaris Dr
- 446 Beccaris Dr
- 451 Beccaris Dr
- 417 Beccaris Dr
- 423 Beccaris Dr
- 428 Beccaris Dr
- 427 Stockdale Cir
- 431 Stockdale Cir
- 415 Beccaris Dr
- 450 Beccaris Dr
- 423 Stockdale Cir
- 437 Stockdale Cir
- 440 Silver St
- 460 Beccaris Dr