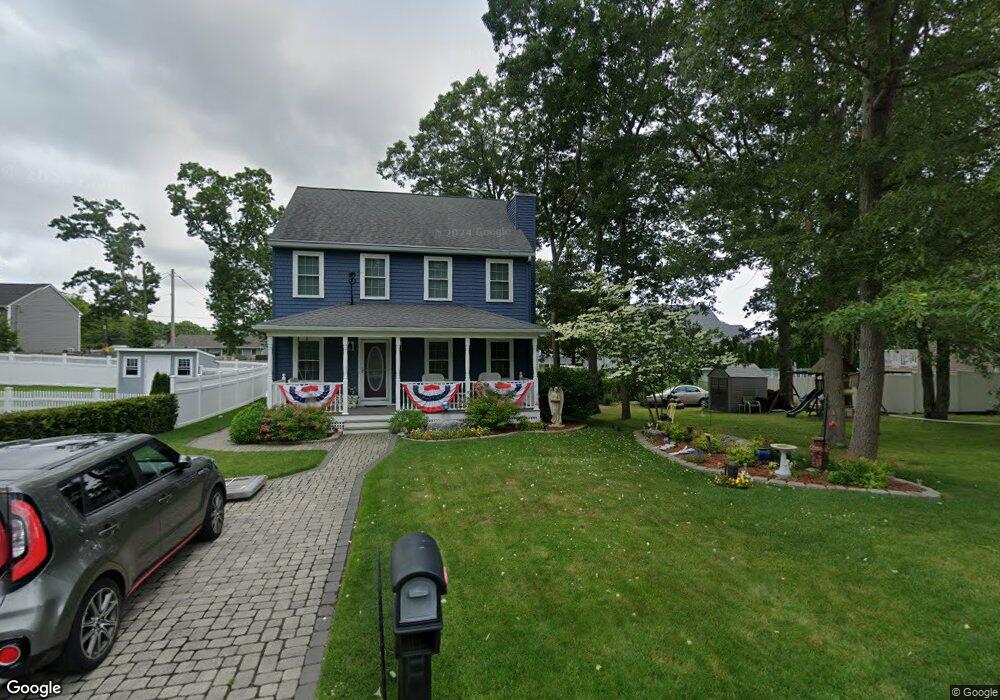
439 Canedy St Fall River, MA 02720
Highlands-Fall River NeighborhoodEstimated Value: $473,468 - $515,000
3
Beds
2
Baths
1,680
Sq Ft
$295/Sq Ft
Est. Value
About This Home
This home is located at 439 Canedy St, Fall River, MA 02720 and is currently estimated at $495,617, approximately $295 per square foot. 439 Canedy St is a home located in Bristol County with nearby schools including North End Elementary School, Morton Middle School, and B M C Durfee High School.
Ownership History
Date
Name
Owned For
Owner Type
Purchase Details
Closed on
May 20, 2005
Sold by
Frank Young Rt
Bought by
Mickle Charles W and Mickle Deborah Ann
Current Estimated Value
Home Financials for this Owner
Home Financials are based on the most recent Mortgage that was taken out on this home.
Original Mortgage
$209,900
Outstanding Balance
$110,216
Interest Rate
5.95%
Mortgage Type
Purchase Money Mortgage
Estimated Equity
$385,401
Create a Home Valuation Report for This Property
The Home Valuation Report is an in-depth analysis detailing your home's value as well as a comparison with similar homes in the area
Home Values in the Area
Average Home Value in this Area
Purchase History
| Date | Buyer | Sale Price | Title Company |
|---|---|---|---|
| Mickle Charles W | $290,000 | -- |
Source: Public Records
Mortgage History
| Date | Status | Borrower | Loan Amount |
|---|---|---|---|
| Open | Mickle Charles W | $209,900 |
Source: Public Records
Tax History
| Year | Tax Paid | Tax Assessment Tax Assessment Total Assessment is a certain percentage of the fair market value that is determined by local assessors to be the total taxable value of land and additions on the property. | Land | Improvement |
|---|---|---|---|---|
| 2025 | $4,613 | $402,900 | $137,600 | $265,300 |
| 2024 | $4,333 | $377,100 | $132,400 | $244,700 |
| 2023 | $4,282 | $349,000 | $114,400 | $234,600 |
| 2022 | $3,762 | $298,100 | $107,000 | $191,100 |
| 2021 | $3,763 | $272,100 | $107,300 | $164,800 |
| 2020 | $3,782 | $261,700 | $107,600 | $154,100 |
| 2019 | $3,751 | $257,300 | $109,300 | $148,000 |
| 2018 | $3,715 | $254,100 | $115,300 | $138,800 |
| 2017 | $3,445 | $246,100 | $109,800 | $136,300 |
| 2016 | $3,275 | $240,300 | $112,100 | $128,200 |
| 2015 | $3,001 | $229,400 | $98,600 | $130,800 |
| 2014 | $2,886 | $229,400 | $98,600 | $130,800 |
Source: Public Records
Map
Nearby Homes
- Parcel 2 Highcrest Rd
- 33 Warner St
- 257 Calvin St
- 1810 Highland Ave Unit 22
- 274 Archer St
- 3216 N Main St
- 201 Montgomery Cir
- 230 College Park Rd
- 29 Valentine St
- 2106 Meridian St
- 247 Albany St
- 195 Crescent St Unit 3
- 108 Stowe St Unit 108
- 174 Columbus Dr
- 333 Langley St
- 27 Kane St
- 3636 N Main St Unit 5
- 208 Florence St
- 17 Langley St
- 25 O'Hearn St
Your Personal Tour Guide
Ask me questions while you tour the home.