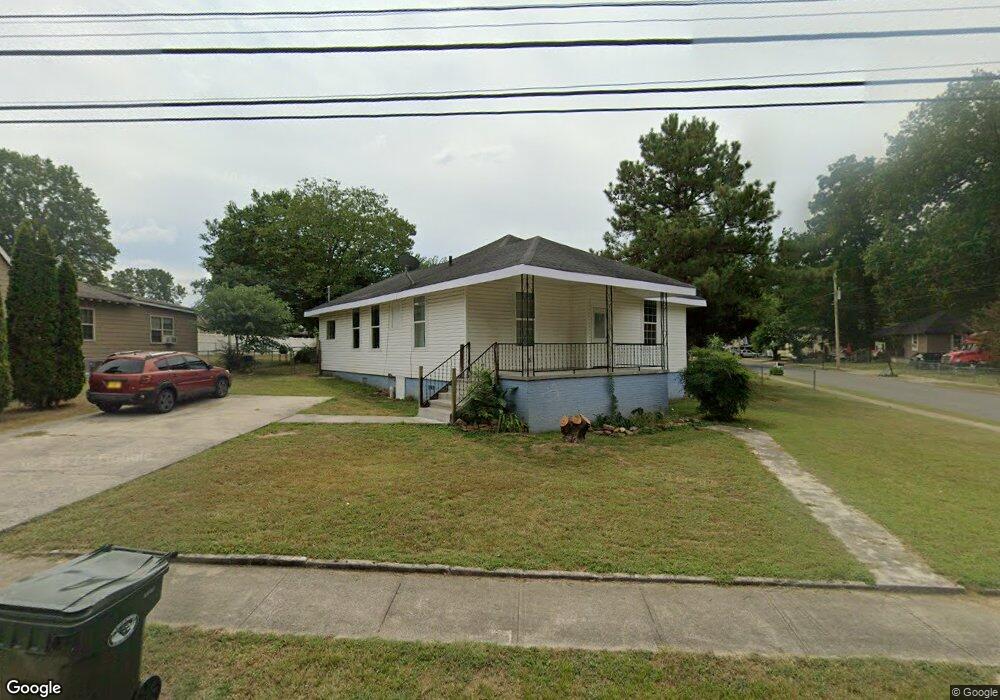
439 Cedar St Dalton, GA 30720
Estimated Value: $173,536 - $222,000
Studio
1
Bath
1,534
Sq Ft
$127/Sq Ft
Est. Value
About This Home
This home is located at 439 Cedar St, Dalton, GA 30720 and is currently estimated at $194,134, approximately $126 per square foot. 439 Cedar St is a home located in Whitfield County with nearby schools including Brookwood Elementary School, Dalton High School, and Rock Hill School.
Ownership History
Date
Name
Owned For
Owner Type
Purchase Details
Closed on
May 18, 2012
Sold by
Safa Investments Llc
Bought by
Virgen Mayra
Current Estimated Value
Purchase Details
Closed on
Mar 23, 2011
Sold by
Hamir Shiraz
Bought by
Safa Investments Llc
Purchase Details
Closed on
Oct 7, 2008
Sold by
Not Provided
Bought by
Safa Investments Llc
Purchase Details
Closed on
Mar 29, 2001
Sold by
Voyles William
Bought by
Ramirez Jose
Purchase Details
Closed on
Jul 1, 1992
Bought by
Voyles William
Create a Home Valuation Report for This Property
The Home Valuation Report is an in-depth analysis detailing your home's value as well as a comparison with similar homes in the area
Purchase History
| Date | Buyer | Sale Price | Title Company |
|---|---|---|---|
| Virgen Mayra | $36,500 | -- | |
| Safa Investments Llc | $12,000 | -- | |
| Safa Investments Llc | $23,720 | -- | |
| Ramirez Jose | $67,500 | -- | |
| Voyles William | $49,900 | -- |
Source: Public Records
Tax History
| Year | Tax Paid | Tax Assessment Tax Assessment Total Assessment is a certain percentage of the fair market value that is determined by local assessors to be the total taxable value of land and additions on the property. | Land | Improvement |
|---|---|---|---|---|
| 2025 | $2,032 | $62,014 | $7,600 | $54,414 |
| 2024 | $2,032 | $62,014 | $7,600 | $54,414 |
| 2023 | $1,757 | $47,363 | $7,200 | $40,163 |
| 2022 | $1,236 | $35,872 | $8,400 | $27,472 |
| 2021 | $1,237 | $35,872 | $8,400 | $27,472 |
| 2020 | $1,285 | $35,872 | $8,400 | $27,472 |
| 2019 | $1,276 | $34,535 | $8,400 | $26,135 |
| 2018 | $1,002 | $26,732 | $8,400 | $18,332 |
| 2017 | $965 | $26,732 | $8,400 | $18,332 |
| 2016 | $713 | $19,624 | $2,940 | $16,684 |
| 2014 | $882 | $26,722 | $2,940 | $23,782 |
| 2013 | -- | $26,721 | $2,940 | $23,781 |
Source: Public Records
Map
Nearby Homes
- 920 Sunset Cir
- 924 Stoneleigh Rd
- 804 Thornton Place
- 903 Hillcrest St
- 1230 W Lakeshore Dr W
- 911 Brookwood Dr
- 703 W Walnut Ave
- 704 W Walnut Ave
- 0 Lakemont Dr Unit 10664970
- 0 Lakemont Dr Unit 1524585
- 0 Lakemont Dr Unit 131479
- 1709 Needham Dr
- 914 W Walnut Ave
- 208 E Walnut Ave
- 1300 Belmont Dr
- 1117 Lakemont Dr
- 1632 Rio Vista Dr
- 115& 134 Independence Way
- 1122 Ridgeleigh Cir
- 1123 Ridgeleigh Cir
Your Personal Tour Guide
Ask me questions while you tour the home.