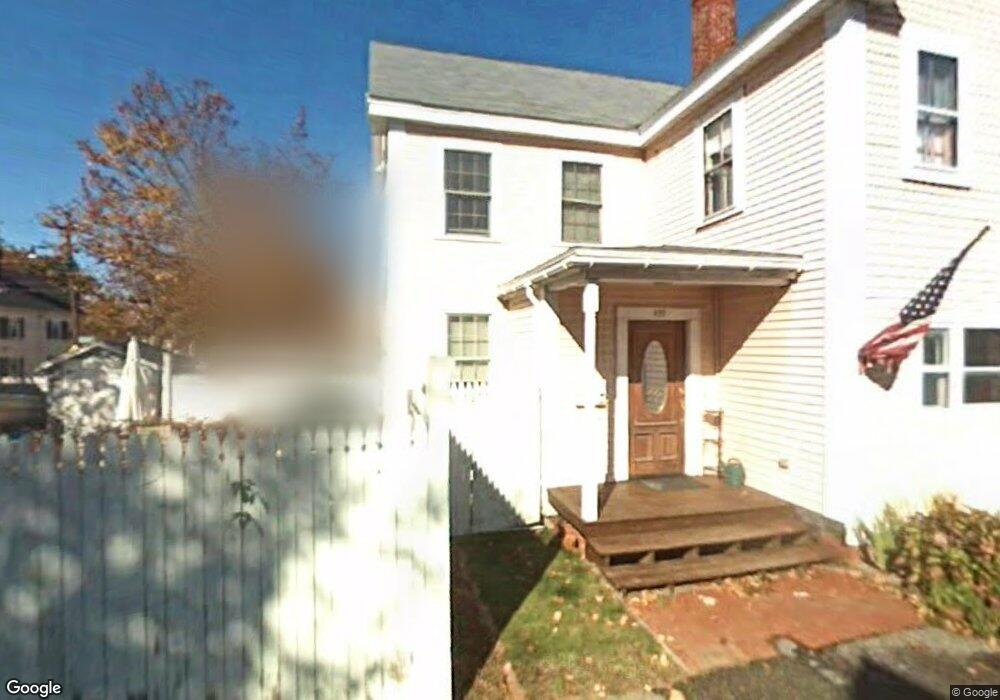
439 Hanover St Portsmouth, NH 03801
West End NeighborhoodEstimated Value: $1,038,000 - $1,416,000
4
Beds
4
Baths
2,406
Sq Ft
$503/Sq Ft
Est. Value
About This Home
This home is located at 439 Hanover St, Portsmouth, NH 03801 and is currently estimated at $1,209,982, approximately $502 per square foot. 439 Hanover St is a home located in Rockingham County with nearby schools including Little Harbour School, Portsmouth Middle School, and Portsmouth High School.
Ownership History
Date
Name
Owned For
Owner Type
Purchase Details
Closed on
Apr 8, 1997
Sold by
Will Gertrude E
Bought by
Wirth A Matthew A and Wirth Michelle B
Current Estimated Value
Home Financials for this Owner
Home Financials are based on the most recent Mortgage that was taken out on this home.
Original Mortgage
$157,150
Interest Rate
7.5%
Mortgage Type
Purchase Money Mortgage
Create a Home Valuation Report for This Property
The Home Valuation Report is an in-depth analysis detailing your home's value as well as a comparison with similar homes in the area
Home Values in the Area
Average Home Value in this Area
Purchase History
| Date | Buyer | Sale Price | Title Company |
|---|---|---|---|
| Wirth A Matthew A | $113,300 | -- |
Source: Public Records
Mortgage History
| Date | Status | Borrower | Loan Amount |
|---|---|---|---|
| Open | Wirth A Matthew A | $100,000 | |
| Closed | Wirth A Matthew A | $75,000 | |
| Closed | Wirth A Matthew A | $157,150 |
Source: Public Records
Tax History Compared to Growth
Tax History
| Year | Tax Paid | Tax Assessment Tax Assessment Total Assessment is a certain percentage of the fair market value that is determined by local assessors to be the total taxable value of land and additions on the property. | Land | Improvement |
|---|---|---|---|---|
| 2024 | $10,524 | $941,300 | $495,400 | $445,900 |
| 2023 | $9,163 | $568,100 | $287,200 | $280,900 |
| 2022 | $8,635 | $568,100 | $287,200 | $280,900 |
| 2021 | $8,539 | $568,100 | $287,200 | $280,900 |
| 2020 | $8,351 | $568,100 | $287,200 | $280,900 |
| 2019 | $8,325 | $560,200 | $287,200 | $273,000 |
| 2018 | $8,522 | $538,000 | $280,600 | $257,400 |
| 2017 | $7,572 | $492,300 | $234,900 | $257,400 |
| 2016 | $7,119 | $417,800 | $177,500 | $240,300 |
| 2015 | $7,015 | $417,800 | $177,500 | $240,300 |
| 2014 | $6,806 | $376,000 | $181,200 | $194,800 |
| 2013 | $6,922 | $386,500 | $181,200 | $205,300 |
| 2012 | $6,783 | $386,500 | $181,200 | $205,300 |
Source: Public Records
Map
Nearby Homes
- 92 Brewster St
- 99 Foundry Place Unit 106
- 99 Foundry Place Unit 408
- 99 Foundry Place Unit 102
- 99 Foundry Place Unit 310
- 99 Foundry Place Unit 109
- 99 Foundry Place Unit 308
- 99 Foundry Place Unit 208
- 99 Foundry Place Unit 101
- 99 Foundry Place Unit 207
- 99 Foundry Place Unit 301
- 99 Foundry Place Unit 206
- 99 Foundry Place Unit 103
- 198 Islington St Unit 6
- 4 Rock St Unit B
- 332 Hanover St
- 51 Islington St Unit 406
- 199 Mcdonough St
- 238 Deer St Unit 305
- 238 Deer St Unit 206
- 4 Mcdonough St
- 427 Hanover St
- 440 Hanover St
- 49 Sudbury St
- 39 Brewster St
- 30 Sudbury St
- 428 Hanover St
- 3 Mcdonough St
- 50 Brewster St
- 31 Sudbury St
- 7 Mcdonough St
- 40 Brewster St
- 40 Brewster St Unit 1
- 40 Brewster St Unit 2
- 16 Mcdonough St
- 21 Brewster St Unit 4
- 21 Brewster St Unit 2
- 21 Brewster St Unit 1
- 21 Brewster St Unit 3
- 21 Brewster St Unit 6