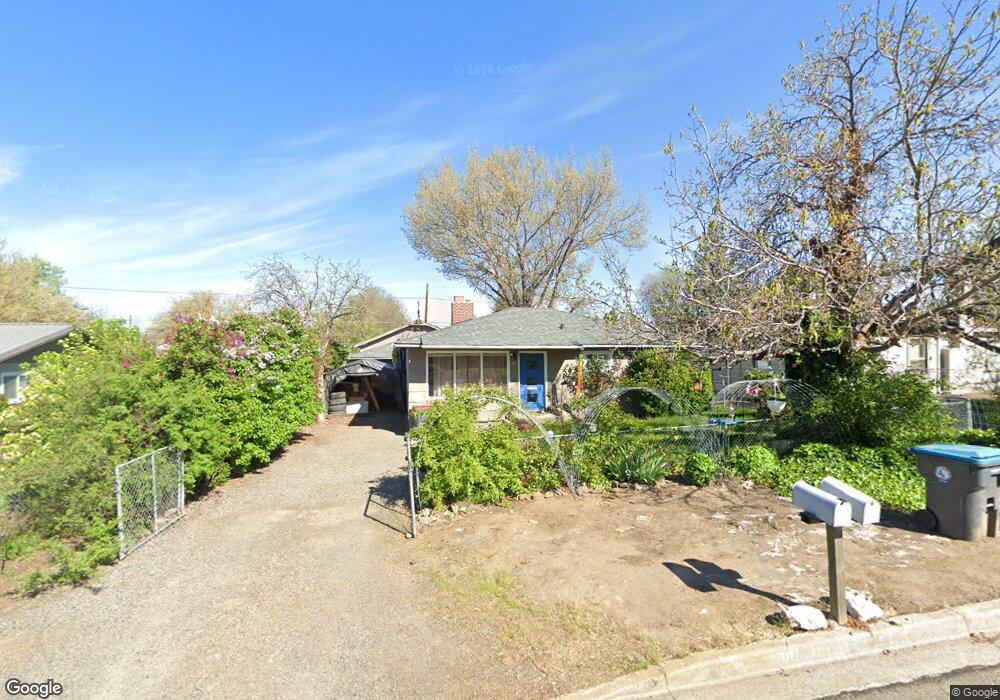
439 Maple St Central Point, OR 97502
Estimated Value: $319,000 - $358,000
5
Beds
2
Baths
1,733
Sq Ft
$191/Sq Ft
Est. Value
About This Home
This home is located at 439 Maple St, Central Point, OR 97502 and is currently estimated at $331,376, approximately $191 per square foot. 439 Maple St is a home located in Jackson County with nearby schools including Jewett Elementary School, Scenic Middle School, and Crater High School.
Ownership History
Date
Name
Owned For
Owner Type
Purchase Details
Closed on
Aug 29, 2006
Sold by
Storrer Kathleen A and Callaway Christopher A
Bought by
Callaway Kathleen A
Current Estimated Value
Purchase Details
Closed on
Jan 22, 2003
Sold by
Lacey Aaron J and Lacey Jamie A
Bought by
Callaway Chris and Storrer Kathy
Home Financials for this Owner
Home Financials are based on the most recent Mortgage that was taken out on this home.
Original Mortgage
$112,000
Interest Rate
5.96%
Mortgage Type
Purchase Money Mortgage
Purchase Details
Closed on
Jan 18, 2002
Sold by
Smith Hanne K
Bought by
Lacey Aaron J and Lacey Jamie A
Home Financials for this Owner
Home Financials are based on the most recent Mortgage that was taken out on this home.
Original Mortgage
$90,000
Interest Rate
7.11%
Mortgage Type
Purchase Money Mortgage
Purchase Details
Closed on
Jul 14, 1998
Sold by
Smith Hanne K and Smith Hanne J
Bought by
Smith Hanne K
Home Financials for this Owner
Home Financials are based on the most recent Mortgage that was taken out on this home.
Original Mortgage
$45,000
Interest Rate
7%
Mortgage Type
Purchase Money Mortgage
Create a Home Valuation Report for This Property
The Home Valuation Report is an in-depth analysis detailing your home's value as well as a comparison with similar homes in the area
Purchase History
| Date | Buyer | Sale Price | Title Company |
|---|---|---|---|
| Callaway Kathleen A | -- | None Available | |
| Callaway Chris | $142,000 | Lawyers Title Insurance Corp | |
| Lacey Aaron J | -- | Amerititle | |
| Smith Hanne K | -- | Key Title Company |
Source: Public Records
Mortgage History
| Date | Status | Borrower | Loan Amount |
|---|---|---|---|
| Previous Owner | Callaway Chris | $112,000 | |
| Previous Owner | Lacey Aaron J | $90,000 | |
| Previous Owner | Smith Hanne K | $45,000 | |
| Closed | Lacey Aaron J | $22,500 |
Source: Public Records
Tax History
| Year | Tax Paid | Tax Assessment Tax Assessment Total Assessment is a certain percentage of the fair market value that is determined by local assessors to be the total taxable value of land and additions on the property. | Land | Improvement |
|---|---|---|---|---|
| 2026 | $3,331 | $201,270 | -- | -- |
| 2025 | $3,249 | $195,410 | $63,170 | $132,240 |
| 2024 | $3,249 | $189,720 | $61,330 | $128,390 |
| 2023 | $3,144 | $184,200 | $59,550 | $124,650 |
| 2022 | $3,071 | $184,200 | $59,550 | $124,650 |
| 2021 | $2,983 | $178,840 | $57,820 | $121,020 |
| 2020 | $2,896 | $173,640 | $56,140 | $117,500 |
| 2019 | $2,825 | $163,680 | $52,920 | $110,760 |
| 2018 | $2,739 | $158,920 | $51,380 | $107,540 |
| 2017 | $2,670 | $158,920 | $51,380 | $107,540 |
| 2016 | $2,592 | $149,810 | $48,430 | $101,380 |
| 2015 | $2,484 | $149,810 | $48,430 | $101,380 |
| 2014 | $2,421 | $141,220 | $45,650 | $95,570 |
Source: Public Records
Map
Nearby Homes
Your Personal Tour Guide
Ask me questions while you tour the home.