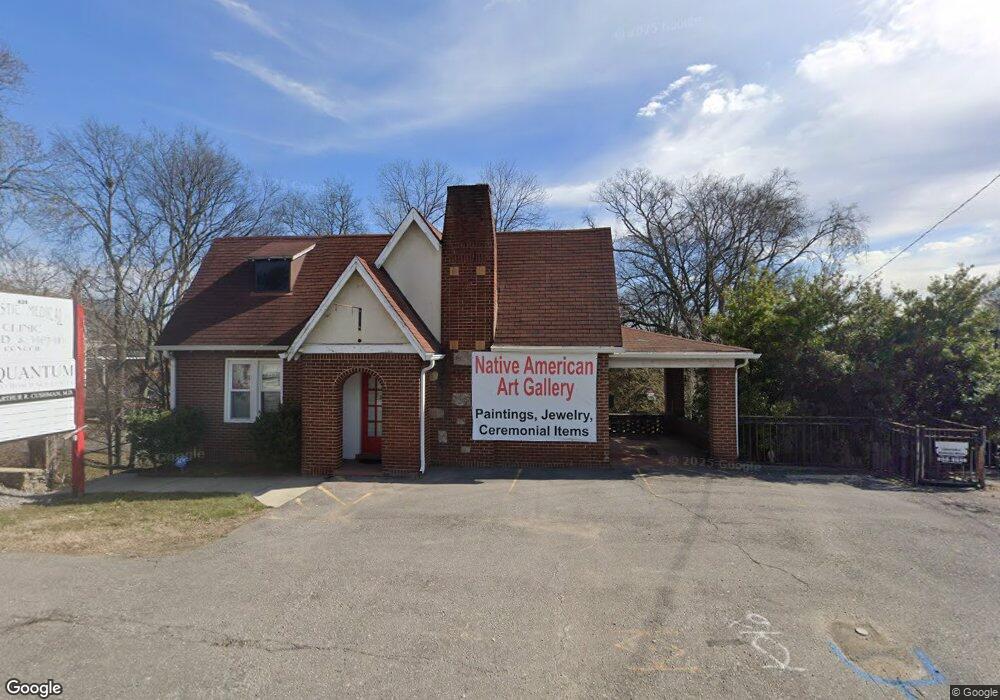
439 N Main St Goodlettsville, TN 37072
Estimated Value: $466,000 - $613,753
3
Beds
2
Baths
3,261
Sq Ft
$164/Sq Ft
Est. Value
About This Home
This home is located at 439 N Main St, Goodlettsville, TN 37072 and is currently estimated at $536,188, approximately $164 per square foot. 439 N Main St is a home with nearby schools including Goodlettsville Elementary School, Goodlettsville Middle School, and Hunters Lane Comprehensive High School.
Ownership History
Date
Name
Owned For
Owner Type
Purchase Details
Closed on
May 3, 2021
Sold by
Cushman Arthur R
Bought by
State Of Tennessee
Current Estimated Value
Purchase Details
Closed on
Jan 23, 2014
Sold by
Enchanted Faerie Llc
Bought by
Cushman Arthur R
Purchase Details
Closed on
Apr 10, 2003
Sold by
James Ralph M and James Sharon M
Bought by
Enchanted Faerie Llc
Home Financials for this Owner
Home Financials are based on the most recent Mortgage that was taken out on this home.
Original Mortgage
$220,000
Interest Rate
5.62%
Mortgage Type
Purchase Money Mortgage
Purchase Details
Closed on
Sep 18, 1995
Bought by
James Ralph M
Create a Home Valuation Report for This Property
The Home Valuation Report is an in-depth analysis detailing your home's value as well as a comparison with similar homes in the area
Home Values in the Area
Average Home Value in this Area
Purchase History
| Date | Buyer | Sale Price | Title Company |
|---|---|---|---|
| State Of Tennessee | -- | None Available | |
| Cushman Arthur R | -- | None Available | |
| Enchanted Faerie Llc | $165,000 | -- | |
| James Ralph M | $120,000 | -- |
Source: Public Records
Mortgage History
| Date | Status | Borrower | Loan Amount |
|---|---|---|---|
| Previous Owner | Enchanted Faerie Llc | $220,000 |
Source: Public Records
Tax History Compared to Growth
Tax History
| Year | Tax Paid | Tax Assessment Tax Assessment Total Assessment is a certain percentage of the fair market value that is determined by local assessors to be the total taxable value of land and additions on the property. | Land | Improvement |
|---|---|---|---|---|
| 2024 | $5,021 | $171,840 | $97,560 | $74,280 |
| 2023 | $5,021 | $171,840 | $97,560 | $74,280 |
| 2022 | $5,021 | $171,840 | $97,560 | $74,280 |
| 2021 | $5,074 | $171,840 | $97,560 | $74,280 |
| 2020 | $5,611 | $148,120 | $97,560 | $50,560 |
| 2019 | $4,081 | $148,120 | $97,560 | $50,560 |
| 2018 | $4,081 | $148,120 | $97,560 | $50,560 |
| 2017 | $4,081 | $148,120 | $97,560 | $50,560 |
| 2016 | $5,572 | $142,000 | $97,560 | $44,440 |
| 2015 | $5,572 | $142,000 | $97,560 | $44,440 |
| 2014 | $5,572 | $142,000 | $97,560 | $44,440 |
Source: Public Records
Map
Nearby Homes
- 112 Mavella Ct
- 301 Moncrief Ave
- 203 W Cedar St
- 205 Cartwright St
- 229 McCoin Dr
- 155 Long Hollow Pike
- 115 East Ave
- 407 Moncrief Ave
- 81 French St
- 290 Dartmoor Place
- 147 Two Mile Pike
- 532 Moncrief Ave
- 10 Brick Church Pike
- 1 Brick Church Pike
- 250 S Downs Cir
- 215 S Downs Cir
- 208 Roscoe St
- 208 Lucien Dr
- 7723 Old Springfield Pike
- 115 Hollywood St
- 502 N Main St
- 434 N Main St
- 410 Bass St
- 429 N Main St
- 408 Bass St
- 406 Bass St
- 404 Bass St
- 107 New Brick Church Pike
- 114 Lindberg St
- 106 Depot St
- 117 Lindberg St
- 106 Dorris Ave
- 520 Church St
- 108 Depot St
- 116 Lindberg St
- 420 N Main St
- 109 New Brick Church Pike
- 411 Bass St
- 119 Lindberg St
- 108 Dorris Ave