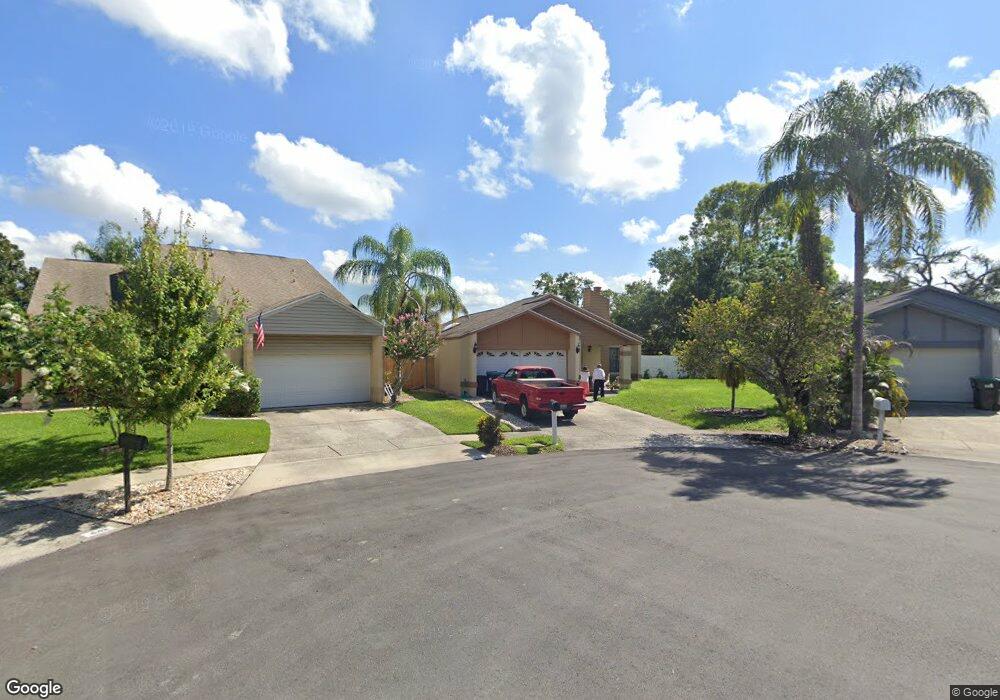
439 Red Coat Ln Orlando, FL 32825
Chickasaw NeighborhoodEstimated Value: $327,000 - $386,000
3
Beds
2
Baths
2,211
Sq Ft
$162/Sq Ft
Est. Value
About This Home
This home is located at 439 Red Coat Ln, Orlando, FL 32825 and is currently estimated at $358,545, approximately $162 per square foot. 439 Red Coat Ln is a home located in Orange County with nearby schools including Little River Elementary School, Union Park Middle School, and Colonial High School.
Ownership History
Date
Name
Owned For
Owner Type
Purchase Details
Closed on
Aug 17, 2014
Sold by
Carr Michael
Bought by
Carr David M and Carr Kelly A
Current Estimated Value
Purchase Details
Closed on
Jan 19, 2010
Sold by
Deutsche Bank National Trust Company
Bought by
Carr Michael
Purchase Details
Closed on
Oct 30, 2009
Sold by
Moreno Elkin and Moreno Carmen
Bought by
Deutsche Bank National Trust Company
Purchase Details
Closed on
Jul 10, 2009
Sold by
Moreno Elkin and Beauchamp Lucy Stella
Bought by
Beauchamp Lucy Stella and Beauchamp Mario
Purchase Details
Closed on
Apr 29, 2005
Sold by
Moreno Elkin
Bought by
Moreno Elkin and Sandoval Lucy
Home Financials for this Owner
Home Financials are based on the most recent Mortgage that was taken out on this home.
Original Mortgage
$138,750
Interest Rate
1%
Mortgage Type
New Conventional
Create a Home Valuation Report for This Property
The Home Valuation Report is an in-depth analysis detailing your home's value as well as a comparison with similar homes in the area
Home Values in the Area
Average Home Value in this Area
Purchase History
| Date | Buyer | Sale Price | Title Company |
|---|---|---|---|
| Carr David M | -- | Attorney | |
| Carr Michael | $95,000 | Attorney | |
| Deutsche Bank National Trust Company | -- | Attorney | |
| Beauchamp Lucy Stella | $76,050 | Attorney | |
| Moreno Elkin | -- | Multiple |
Source: Public Records
Mortgage History
| Date | Status | Borrower | Loan Amount |
|---|---|---|---|
| Previous Owner | Moreno Elkin | $138,750 |
Source: Public Records
Tax History
| Year | Tax Paid | Tax Assessment Tax Assessment Total Assessment is a certain percentage of the fair market value that is determined by local assessors to be the total taxable value of land and additions on the property. | Land | Improvement |
|---|---|---|---|---|
| 2025 | $5,494 | $315,590 | $55,000 | $260,590 |
| 2024 | $4,646 | $303,280 | $55,000 | $248,280 |
| 2023 | $4,646 | $306,698 | $55,000 | $251,698 |
| 2022 | $4,164 | $267,005 | $55,000 | $212,005 |
| 2021 | $3,646 | $208,044 | $40,000 | $168,044 |
| 2020 | $3,346 | $196,178 | $40,000 | $156,178 |
| 2019 | $3,407 | $198,684 | $40,000 | $158,684 |
| 2018 | $3,112 | $174,190 | $34,000 | $140,190 |
| 2017 | $2,813 | $150,004 | $27,000 | $123,004 |
| 2016 | $2,693 | $140,978 | $27,000 | $113,978 |
| 2015 | $2,616 | $133,158 | $26,000 | $107,158 |
| 2014 | $2,380 | $124,901 | $30,000 | $94,901 |
Source: Public Records
Map
Nearby Homes
- 435 Loblolly Ln
- 418 Red Coat Ln
- 682 Ascot Cir
- 766 Ashley Ln
- 321 River Chase Dr
- 916 Ponderosa Pine Ct
- 7960 Soft Pine Cir Unit I
- 8112 Claire Ann Dr Unit 107
- 8203 Sun Spring Cir Unit 12
- 8225 Claire Ann Dr Unit 101
- 8213 Claire Ann Dr Unit 108
- 8205 Sun Spring Cir Unit C2
- 8213 Sun Spring Cir Unit 61
- 8211 Sun Spring Cir Unit 42
- 7962 Niagara Falls Ct
- 1137 N Chickasaw Trail
- 7806 Bear Claw Run
- 7908 Bear Claw Run
- 7525 Azalea Cove Cir
- 7338 Azalea Cove Cir
- 443 Red Coat Ln
- 435 Red Coat Ln
- 454 Loblolly Ln
- 448 Loblolly Ln
- 431 Red Coat Ln
- 442 Red Coat Ln
- 438 Red Coat Ln
- 447 Loblolly Ln
- 7842 Copperfield Ct
- 442 Loblolly Ln
- 7836 Copperfield Ct
- 427 Red Coat Ln
- 7848 Copperfield Ct
- 7830 Copperfield Ct
- 7830 Copperfield Ct Unit 1B
- 434 Red Coat Ln
- 7854 Copperfield Ct
- 7860 Copperfield Ct
- 430 Red Coat Ln
- 423 Red Coat Ln
Your Personal Tour Guide
Ask me questions while you tour the home.