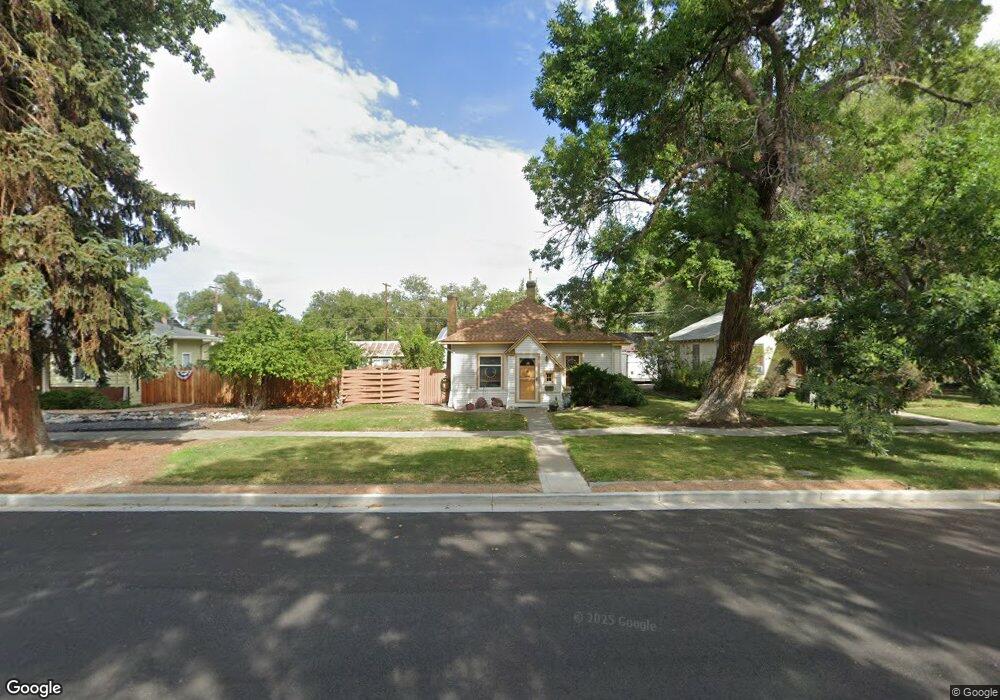
439 S 6th St Montrose, CO 81401
Estimated Value: $271,000 - $343,000
--
Bed
1
Bath
1,174
Sq Ft
$259/Sq Ft
Est. Value
About This Home
This home is located at 439 S 6th St, Montrose, CO 81401 and is currently estimated at $304,190, approximately $259 per square foot. 439 S 6th St is a home located in Montrose County with nearby schools including Pomona Elementary School, Centennial Middle School, and Montrose High School.
Ownership History
Date
Name
Owned For
Owner Type
Purchase Details
Closed on
Feb 19, 1998
Sold by
Rusher Robert L and Rusher Dorothy M
Bought by
Blaylock Virginia L and Blaylock John L
Current Estimated Value
Purchase Details
Closed on
Oct 27, 1993
Sold by
Jones James H
Bought by
Blaylock Virginia L and Blaylock John L
Purchase Details
Closed on
Oct 16, 1992
Sold by
Patterson Frank David M and Patterson Frank Susan B
Bought by
Jones James H
Purchase Details
Closed on
Feb 20, 1992
Sold by
Patterson Susan B
Bought by
Patterson Frank David M and Patterson Frank Susan B
Purchase Details
Closed on
Oct 12, 1989
Sold by
Cencich Rodney Earl and Cencich Barbara W
Bought by
Patterson Susan B
Purchase Details
Closed on
May 6, 1981
Sold by
Rauscher J A
Bought by
Cencich Rodney Earl and Cencich Barbara W
Purchase Details
Closed on
Jul 15, 1976
Sold by
Knose Jack E and Knose Jean M
Bought by
Rauscher W E W and Rauscher J A
Create a Home Valuation Report for This Property
The Home Valuation Report is an in-depth analysis detailing your home's value as well as a comparison with similar homes in the area
Home Values in the Area
Average Home Value in this Area
Purchase History
| Date | Buyer | Sale Price | Title Company |
|---|---|---|---|
| Blaylock Virginia L | -- | -- | |
| Blaylock Virginia L | $67,700 | -- | |
| Jones James H | $59,500 | -- | |
| Patterson Frank David M | -- | -- | |
| Patterson Susan B | $45,000 | -- | |
| Cencich Rodney Earl | $49,500 | -- | |
| Rauscher W E W | $25,000 | -- |
Source: Public Records
Tax History Compared to Growth
Tax History
| Year | Tax Paid | Tax Assessment Tax Assessment Total Assessment is a certain percentage of the fair market value that is determined by local assessors to be the total taxable value of land and additions on the property. | Land | Improvement |
|---|---|---|---|---|
| 2024 | $1,217 | $17,090 | $3,030 | $14,060 |
| 2023 | $1,217 | $21,550 | $3,820 | $17,730 |
| 2022 | $924 | $13,430 | $2,780 | $10,650 |
| 2021 | $952 | $13,810 | $2,860 | $10,950 |
| 2020 | $825 | $12,290 | $2,470 | $9,820 |
| 2019 | $830 | $12,290 | $2,470 | $9,820 |
| 2018 | $662 | $9,560 | $1,990 | $7,570 |
| 2017 | $656 | $9,560 | $1,990 | $7,570 |
| 2016 | $646 | $9,560 | $2,010 | $7,550 |
| 2015 | $634 | $9,560 | $2,010 | $7,550 |
| 2014 | $596 | $9,620 | $2,010 | $7,610 |
Source: Public Records
Map
Nearby Homes
- 612 & 616 S 6th
- TBD S 4th St
- 902 S Mesa Ave
- 814 S 7th St
- 801 S Nevada Ave
- 23 S 5th St
- 535 S 11th St Unit 5
- 85 Colorado Ave
- 909 S 10th St
- 825 S 1st St
- 147 E Main St Unit 147 Main , 18 N Se
- 103 Duncan Place
- 122 Spruce Dr
- 9 Aspen St
- 119 Akard Ave
- 505 Miami Rd
- 1037 N 1st St
- 1413 Chatam Dr
- 701 N 4th St
- 1128 Highland Dr