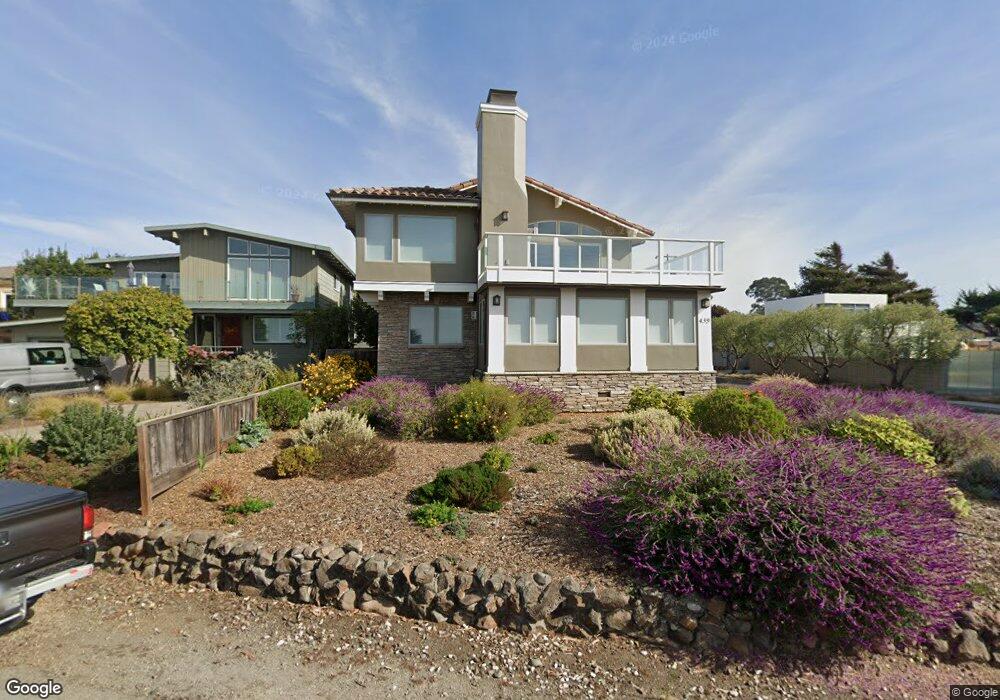
439 Seaview Dr Aptos, CA 95003
Rio del Mar NeighborhoodEstimated Value: $2,569,000 - $2,752,000
3
Beds
3
Baths
2,672
Sq Ft
$985/Sq Ft
Est. Value
About This Home
This home is located at 439 Seaview Dr, Aptos, CA 95003 and is currently estimated at $2,632,650, approximately $985 per square foot. 439 Seaview Dr is a home located in Santa Cruz County with nearby schools including Rio Del Mar Elementary School, Aptos Junior High School, and Aptos High School.
Ownership History
Date
Name
Owned For
Owner Type
Purchase Details
Closed on
Mar 31, 2012
Sold by
Lazar Jack R and Lazar Deirdre A
Bought by
Lazar Jack R and Lazar Deirdre A
Current Estimated Value
Purchase Details
Closed on
Dec 12, 2006
Sold by
Kinder Janet Marie and Breen Douglas James
Bought by
Lazar Jack R and Lazar Deirdre A
Home Financials for this Owner
Home Financials are based on the most recent Mortgage that was taken out on this home.
Original Mortgage
$500,000
Outstanding Balance
$285,311
Interest Rate
5.5%
Mortgage Type
Purchase Money Mortgage
Estimated Equity
$2,347,339
Purchase Details
Closed on
Apr 28, 2006
Sold by
Breen Dora Jane and Henry & Dora Breen Trust
Bought by
Breen Dora Jane and Breen Henry
Home Financials for this Owner
Home Financials are based on the most recent Mortgage that was taken out on this home.
Original Mortgage
$843,554
Interest Rate
6.46%
Mortgage Type
New Conventional
Purchase Details
Closed on
Jan 27, 1998
Sold by
Breen Henry D and Breen Dora J
Bought by
Breen Henry D and Breen Dora Jane
Create a Home Valuation Report for This Property
The Home Valuation Report is an in-depth analysis detailing your home's value as well as a comparison with similar homes in the area
Home Values in the Area
Average Home Value in this Area
Purchase History
| Date | Buyer | Sale Price | Title Company |
|---|---|---|---|
| Lazar Jack R | -- | None Available | |
| Lazar Jack R | $1,500,000 | First American Title Company | |
| Breen Dora Jane | -- | None Available | |
| Breen Henry D | -- | -- |
Source: Public Records
Mortgage History
| Date | Status | Borrower | Loan Amount |
|---|---|---|---|
| Open | Lazar Jack R | $500,000 | |
| Previous Owner | Breen Dora Jane | $843,554 |
Source: Public Records
Tax History
| Year | Tax Paid | Tax Assessment Tax Assessment Total Assessment is a certain percentage of the fair market value that is determined by local assessors to be the total taxable value of land and additions on the property. | Land | Improvement |
|---|---|---|---|---|
| 2025 | $23,506 | $2,092,102 | $1,406,777 | $685,325 |
| 2023 | $23,097 | $2,010,863 | $1,352,150 | $658,713 |
| 2022 | $22,654 | $1,971,434 | $1,325,637 | $645,797 |
| 2021 | $22,151 | $1,932,780 | $1,299,645 | $633,135 |
| 2020 | $21,802 | $1,912,960 | $1,286,318 | $626,642 |
| 2019 | $21,421 | $1,875,451 | $1,261,096 | $614,355 |
| 2018 | $20,862 | $1,838,678 | $1,236,369 | $602,309 |
| 2017 | $19,994 | $1,738,720 | $983,477 | $755,243 |
| 2016 | $18,449 | $1,609,926 | $910,627 | $699,299 |
| 2015 | $17,610 | $1,518,798 | $859,081 | $659,717 |
| 2014 | $15,888 | $1,368,286 | $773,945 | $594,341 |
Source: Public Records
Map
Nearby Homes
- 433 Seaview Dr
- 457 Townsend Dr
- 511 Cliff Dr
- 320 Cliff Dr
- 227 Kingsbury Dr
- 545 Beach Dr
- 547 Beach Dr
- 322 Arthur Ave
- 325 Beach Dr
- 619 Beach Dr
- 329 Los Altos Dr
- 621 Beach Dr
- 273 Rio Del Mar Blvd
- 240 Rio Del Mar Blvd Unit O
- 229 Rio Del Mar Blvd
- 220 Beach Dr
- 610 Rio Del Mar Blvd
- 140 Marina Ave Unit A
- 130 Hainline Rd
- 373 Sandalwood Dr
Your Personal Tour Guide
Ask me questions while you tour the home.