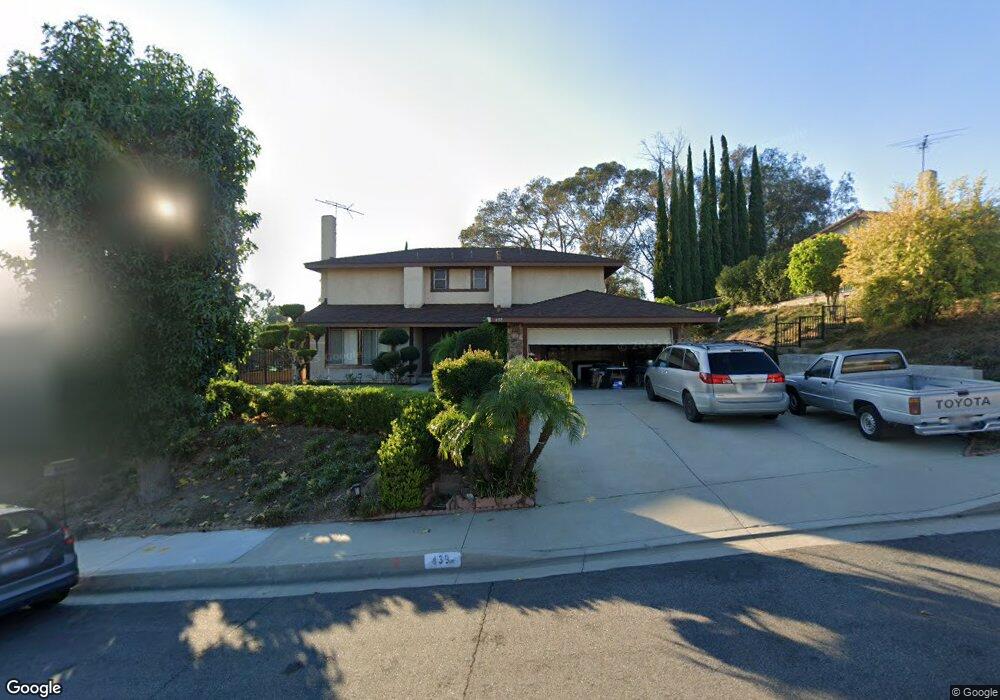
439 Via Quinto Walnut, CA 91789
Estimated Value: $989,748 - $1,136,000
4
Beds
3
Baths
1,859
Sq Ft
$588/Sq Ft
Est. Value
About This Home
This home is located at 439 Via Quinto, Walnut, CA 91789 and is currently estimated at $1,093,687, approximately $588 per square foot. 439 Via Quinto is a home located in Los Angeles County with nearby schools including Hollingworth Elementary School, Nogales High School, and Walnut Montessori Preschool Academy.
Ownership History
Date
Name
Owned For
Owner Type
Purchase Details
Closed on
Jan 7, 1999
Sold by
First Trust National Assn
Bought by
Doan Tuan Duc and Do Chau Minh
Current Estimated Value
Home Financials for this Owner
Home Financials are based on the most recent Mortgage that was taken out on this home.
Original Mortgage
$172,500
Outstanding Balance
$39,563
Interest Rate
6.63%
Estimated Equity
$1,054,124
Purchase Details
Closed on
Jun 25, 1998
Sold by
Grospe Nathanael and Aragon Teresa E
Bought by
First Trust National Assn
Purchase Details
Closed on
Aug 3, 1996
Sold by
Grospe Nathanael and Aragon Teresa Emily M
Bought by
Grospe Nathanael and Grospe Teresa Emily M
Home Financials for this Owner
Home Financials are based on the most recent Mortgage that was taken out on this home.
Original Mortgage
$30,000
Interest Rate
8.42%
Create a Home Valuation Report for This Property
The Home Valuation Report is an in-depth analysis detailing your home's value as well as a comparison with similar homes in the area
Home Values in the Area
Average Home Value in this Area
Purchase History
| Date | Buyer | Sale Price | Title Company |
|---|---|---|---|
| Doan Tuan Duc | $230,000 | First American Title Co | |
| First Trust National Assn | $218,000 | Stewart Title | |
| Grospe Nathanael | -- | United Title Company |
Source: Public Records
Mortgage History
| Date | Status | Borrower | Loan Amount |
|---|---|---|---|
| Open | Doan Tuan Duc | $172,500 | |
| Previous Owner | Grospe Nathanael | $30,000 |
Source: Public Records
Tax History
| Year | Tax Paid | Tax Assessment Tax Assessment Total Assessment is a certain percentage of the fair market value that is determined by local assessors to be the total taxable value of land and additions on the property. | Land | Improvement |
|---|---|---|---|---|
| 2025 | $4,959 | $360,552 | $206,458 | $154,094 |
| 2024 | $4,959 | $353,483 | $202,410 | $151,073 |
| 2023 | $4,803 | $346,553 | $198,442 | $148,111 |
| 2022 | $4,703 | $339,758 | $194,551 | $145,207 |
| 2021 | $4,621 | $333,097 | $190,737 | $142,360 |
| 2019 | $4,491 | $323,220 | $185,081 | $138,139 |
| 2018 | $4,273 | $316,883 | $181,452 | $135,431 |
| 2016 | $4,110 | $304,580 | $174,407 | $130,173 |
| 2015 | $4,047 | $300,006 | $171,788 | $128,218 |
| 2014 | $4,045 | $294,130 | $168,423 | $125,707 |
Source: Public Records
Map
Nearby Homes
- 19569 Vista Hermosa Dr
- 19410 Empty Saddle Rd
- 3228 La Puente Rd
- 19466 Avenida Del Campo
- 3136 La Puente Rd
- 3300 E Millridge Dr
- 3632 S Morganfield Ave
- 309 Camino de Gloria
- 3659 Agate Way Unit 199
- 2839 Onyx Way
- 19200 Kamlyn Ln
- 370 Camino de Teodoro
- 376 Camino de Teodoro
- 3616 Hemlock Ln
- 3616 Whittlers Ln
- 3816 Sycamore St
- 513 Camino de Gloria
- 19019 Garnet Way
- 19245 E Campton St
- 359 Addleman Ave
- 449 Via Quinto
- 435 Via Quinto
- 455 Via Quinto
- 430 Calle Alcazar
- 425 Via Quinto
- 436 Via Quinto
- 440 Via Quinto
- 426 Calle Alcazar
- 450 Via Quinto
- 430 Via Quinto
- 411 Via Quinto
- 438 Calle Alcazar
- 19686 Vista Hermosa Dr
- 19692 Vista Hermosa Dr
- 454 Via Quinto
- 420 Via Quinto
- 19680 Vista Hermosa Dr
- 420 Calle Alcazar
- 460 Via Quinto
- 435 San Roque Dr
Your Personal Tour Guide
Ask me questions while you tour the home.