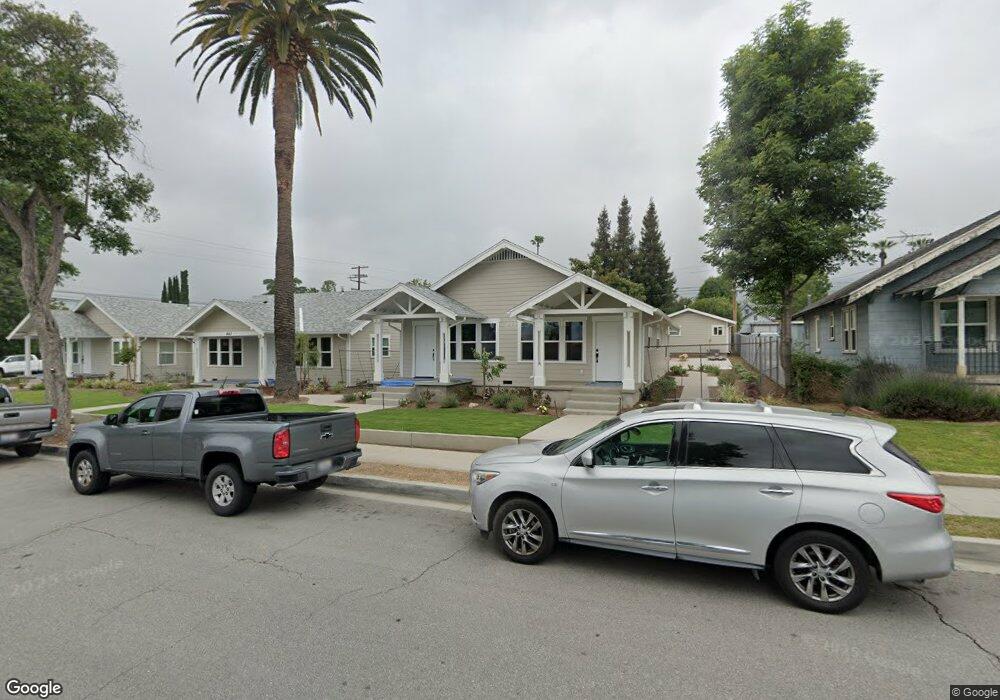
439 W Lime Ave Monrovia, CA 91016
Estimated Value: $889,000 - $2,351,000
Studio
--
Bath
1,220
Sq Ft
$1,090/Sq Ft
Est. Value
About This Home
This home is located at 439 W Lime Ave, Monrovia, CA 91016 and is currently estimated at $1,330,104, approximately $1,090 per square foot. 439 W Lime Ave is a home located in Los Angeles County with nearby schools including Monroe Elementary School, Santa Fe Computer Science Magnet, and Monrovia High School.
Ownership History
Date
Name
Owned For
Owner Type
Purchase Details
Closed on
Mar 9, 2026
Sold by
Mark Williams and Mark Williams Separate Property Trust
Bought by
Mark Williams Separate Property Trust and Williams
Current Estimated Value
Home Financials for this Owner
Home Financials are based on the most recent Mortgage that was taken out on this home.
Original Mortgage
$1,155,000
Outstanding Balance
$1,155,000
Interest Rate
5.38%
Mortgage Type
New Conventional
Estimated Equity
$175,104
Purchase Details
Closed on
Oct 24, 2019
Sold by
Jaworski Karen A and Revocable Trust Of Fredric Dav
Bought by
Williams Dennis E and Williams Virginia J
Purchase Details
Closed on
Oct 22, 2019
Sold by
Williams Tiffany C
Bought by
Williams Mark
Purchase Details
Closed on
May 5, 1999
Sold by
Worsford Jocelyn M
Bought by
Kyle Fred D
Purchase Details
Closed on
Apr 1, 1999
Sold by
Kyle Fred D
Bought by
Kyle Fred
Purchase Details
Closed on
Jul 11, 1997
Sold by
Pufky Sanra M
Bought by
Kyle Fred
Create a Home Valuation Report for This Property
The Home Valuation Report is an in-depth analysis detailing your home's value as well as a comparison with similar homes in the area
Home Values in the Area
Average Home Value in this Area
Purchase History
| Date | Buyer | Sale Price | Title Company |
|---|---|---|---|
| Mark Williams Separate Property Trust | -- | Essent Title Insurance | |
| Williams Dennis E | $2,020,000 | Chicago Title Company | |
| Williams Mark | -- | Chicago Title Company | |
| Kyle Fred D | -- | -- | |
| Kyle Fred | -- | -- | |
| Kyle Fred | -- | -- |
Source: Public Records
Mortgage History
| Date | Status | Borrower | Loan Amount |
|---|---|---|---|
| Open | Mark Williams Separate Property Trust | $1,155,000 |
Source: Public Records
Tax History
| Year | Tax Paid | Tax Assessment Tax Assessment Total Assessment is a certain percentage of the fair market value that is determined by local assessors to be the total taxable value of land and additions on the property. | Land | Improvement |
|---|---|---|---|---|
| 2025 | $10,423 | $773,201 | $309,498 | $463,703 |
| 2024 | $10,423 | $758,041 | $303,430 | $454,611 |
| 2023 | $10,184 | $743,179 | $297,481 | $445,698 |
| 2022 | $9,889 | $728,608 | $291,649 | $436,959 |
| 2021 | $9,699 | $714,323 | $285,931 | $428,392 |
| 2020 | $9,404 | $707,000 | $283,000 | $424,000 |
| 2019 | $3,971 | $267,353 | $190,997 | $76,356 |
| 2018 | $3,852 | $262,111 | $187,252 | $74,859 |
| 2016 | $3,705 | $251,935 | $179,982 | $71,953 |
| 2015 | $3,628 | $248,152 | $177,279 | $70,873 |
| 2014 | $3,603 | $243,292 | $173,807 | $69,485 |
Source: Public Records
Map
Nearby Homes
- 305 S Mayflower Ave
- 347 W Lemon Ave
- 516 Linwood Ave
- 105 S Mayflower Ave Unit E
- 550 W Foothill Blvd Unit C
- 267 Linwood Ave Unit E
- 210 W Lime Ave
- 709 S Magnolia Ave
- 205 Violet Ave Unit D
- 221 Violet Ave
- 511 W Maple Ave
- 729 W Foothill Blvd
- 112 N Garfield Place
- 228 Oaks Ave
- 137 N Myrtle Ave
- 855 W Walnut Ave
- 725 W Hillcrest Blvd
- 1218 S Mayflower Ave Unit B
- 113 N Ivy Ave Unit 113 & 115
- 108 Peppertree Ln
- 443 W Lime Ave Unit 7
- 443 W Lime Ave
- 435 W Lime Ave
- 431 W Lime Ave
- 447 W Lime Ave
- 429 W Lime Ave
- 411 W Lime Ave
- 427 W Lime Ave
- 308 S Mayflower Ave
- 442 W Palm Ave
- 436 W Palm Ave Unit 1/2
- 436 W Palm Ave
- 440 W Lime Ave
- 306 S Mayflower Ave
- 425 W Lime Ave Unit 1
- 425 W Lime Ave
- 444 W Lime Ave
- 432 W Palm Ave
- 501 W Lime Ave Unit B
- 501 W Lime Ave
Your Personal Tour Guide
Ask me questions while you tour the home.