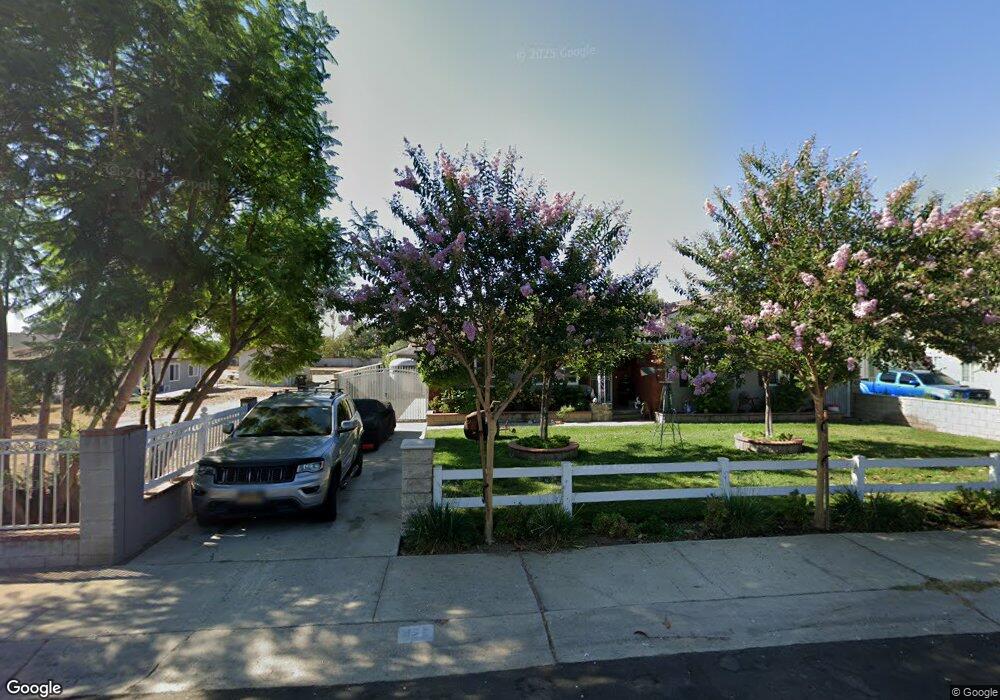
439 W Maple St Ontario, CA 91762
Downtown Ontario NeighborhoodEstimated Value: $559,000 - $633,103
2
Beds
1
Bath
756
Sq Ft
$787/Sq Ft
Est. Value
About This Home
This home is located at 439 W Maple St, Ontario, CA 91762 and is currently estimated at $595,026, approximately $787 per square foot. 439 W Maple St is a home located in San Bernardino County with nearby schools including Richard Haynes Elementary, Oaks Middle, and Ontario High School.
Ownership History
Date
Name
Owned For
Owner Type
Purchase Details
Closed on
Apr 17, 2017
Sold by
Crocker Nancy A and Bartholomy Nancy A
Bought by
Solorio Diego A
Current Estimated Value
Home Financials for this Owner
Home Financials are based on the most recent Mortgage that was taken out on this home.
Original Mortgage
$299,475
Outstanding Balance
$246,854
Interest Rate
3.87%
Mortgage Type
FHA
Estimated Equity
$348,172
Create a Home Valuation Report for This Property
The Home Valuation Report is an in-depth analysis detailing your home's value as well as a comparison with similar homes in the area
Home Values in the Area
Average Home Value in this Area
Purchase History
| Date | Buyer | Sale Price | Title Company |
|---|---|---|---|
| Solorio Diego A | $305,000 | First American Title Company | |
| Crocker Nancy A | -- | First American Title Company |
Source: Public Records
Mortgage History
| Date | Status | Borrower | Loan Amount |
|---|---|---|---|
| Open | Solorio Diego A | $299,475 |
Source: Public Records
Tax History
| Year | Tax Paid | Tax Assessment Tax Assessment Total Assessment is a certain percentage of the fair market value that is determined by local assessors to be the total taxable value of land and additions on the property. | Land | Improvement |
|---|---|---|---|---|
| 2025 | $3,899 | $353,979 | $123,892 | $230,087 |
| 2024 | $3,810 | $347,038 | $121,463 | $225,575 |
| 2023 | $1,789 | $163,312 | $119,082 | $44,230 |
| 2022 | $1,766 | $160,110 | $116,747 | $43,363 |
| 2021 | $3,632 | $327,022 | $114,458 | $212,564 |
| 2020 | $3,568 | $323,668 | $113,284 | $210,384 |
| 2019 | $3,537 | $317,322 | $111,063 | $206,259 |
| 2018 | $3,489 | $311,100 | $108,885 | $202,215 |
| 2017 | $1,612 | $145,142 | $72,571 | $72,571 |
| 2016 | $1,548 | $142,296 | $71,148 | $71,148 |
| 2015 | $1,538 | $140,158 | $70,079 | $70,079 |
| 2014 | $1,490 | $137,412 | $68,706 | $68,706 |
Source: Public Records
Map
Nearby Homes
- 214 W Locust St
- 1546 Redwood Ave
- 1420 S Euclid Ave
- 2041 S Oakland Ave
- 908 W Linden St
- 304 E Cedar St
- 1206 S Cypress Ave Unit F
- 1223 S Plum Ave
- 329 W Maitland St
- 1216 S Cypress Ave Unit E
- 1230 S Cypress Ave
- 1343 S Sultana Ave
- 1112 S Cypress Ave
- 1650 S Campus Ave Unit 12
- 1214 S Sultana Ave
- 250 W Via Presido Unit 105
- 1209 S Palmetto Ave Unit C
- 1027 Eclipse Ct
- 1031 S Palmetto Ave Unit S-8
- 1031 S Palmetto Ave Unit A2
- 445 W Maple St
- 431 W Maple St
- 453 W Maple St
- 427 W Maple St
- 459 W Maple St
- 454 W Maple St
- 415 W Maple St
- 503 W Maple St
- 448 W Maple St
- 460 W Maple St
- 414 W Maple St
- 502 W Maple St
- 509 W Maple St
- 405 W Maple St
- 1712 S Fern Ave
- 432 W Maple St
- 504 W Maple St
- 1722 S Fern Ave
- 515 W Maple St
- 402 W Maple St
Your Personal Tour Guide
Ask me questions while you tour the home.