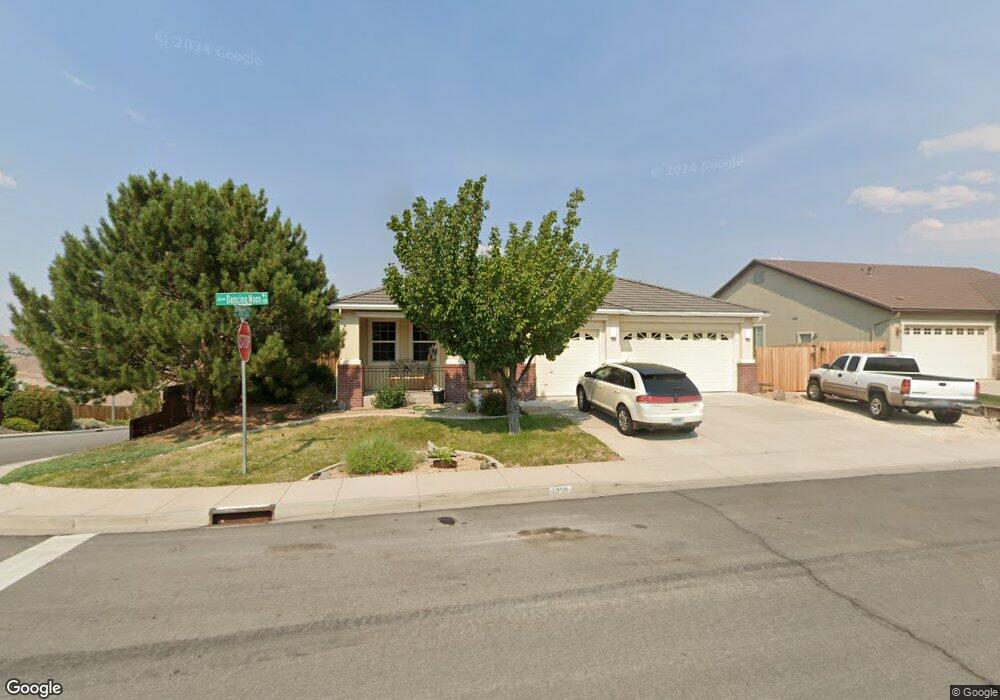
4390 Dancing Moon Way Sparks, NV 89436
Los Altos Parkway NeighborhoodEstimated Value: $631,091 - $745,000
3
Beds
2
Baths
2,070
Sq Ft
$326/Sq Ft
Est. Value
About This Home
This home is located at 4390 Dancing Moon Way, Sparks, NV 89436 and is currently estimated at $675,023, approximately $326 per square foot. 4390 Dancing Moon Way is a home located in Washoe County with nearby schools including Bud Beasley Elementary School, Edward C Reed High School, and Legacy Christian School.
Ownership History
Date
Name
Owned For
Owner Type
Purchase Details
Closed on
Jul 16, 2021
Sold by
Story Susan H
Bought by
Story Susan H and Susan H Sotry Living Trust
Current Estimated Value
Home Financials for this Owner
Home Financials are based on the most recent Mortgage that was taken out on this home.
Original Mortgage
$189,575
Outstanding Balance
$107,057
Interest Rate
2.9%
Mortgage Type
New Conventional
Estimated Equity
$567,966
Purchase Details
Closed on
Nov 3, 2006
Sold by
Story Susan H
Bought by
Story Susan H and Susan H Story Living Trust
Purchase Details
Closed on
May 6, 2003
Sold by
Centex Homes
Bought by
Havemann Larry J and Havemann Virginia C
Purchase Details
Closed on
Jan 10, 2003
Sold by
Centex Homes
Bought by
Story Susan H
Home Financials for this Owner
Home Financials are based on the most recent Mortgage that was taken out on this home.
Original Mortgage
$222,900
Interest Rate
6.15%
Create a Home Valuation Report for This Property
The Home Valuation Report is an in-depth analysis detailing your home's value as well as a comparison with similar homes in the area
Home Values in the Area
Average Home Value in this Area
Purchase History
| Date | Buyer | Sale Price | Title Company |
|---|---|---|---|
| Story Susan H | -- | Amrock Llc | |
| Story Susan H | -- | Amrock Llc | |
| Story Susan H | -- | None Available | |
| Havemann Larry J | $331,680 | Stewart Title Of Northern Nv | |
| Story Susan H | $278,670 | Stewart Title Of Northern Nv |
Source: Public Records
Mortgage History
| Date | Status | Borrower | Loan Amount |
|---|---|---|---|
| Open | Story Susan H | $189,575 | |
| Previous Owner | Story Susan H | $222,900 |
Source: Public Records
Tax History Compared to Growth
Tax History
| Year | Tax Paid | Tax Assessment Tax Assessment Total Assessment is a certain percentage of the fair market value that is determined by local assessors to be the total taxable value of land and additions on the property. | Land | Improvement |
|---|---|---|---|---|
| 2025 | $4,760 | $175,433 | $58,212 | $117,221 |
| 2024 | $4,760 | $170,911 | $52,577 | $118,334 |
| 2023 | $4,409 | $166,080 | $56,252 | $109,828 |
| 2022 | $4,084 | $139,780 | $47,654 | $92,126 |
| 2021 | $3,781 | $132,336 | $40,651 | $91,685 |
| 2020 | $3,555 | $130,822 | $38,367 | $92,455 |
| 2019 | $3,387 | $125,672 | $37,240 | $88,432 |
| 2018 | $3,231 | $114,209 | $27,636 | $86,573 |
| 2017 | $3,067 | $113,204 | $27,636 | $85,568 |
| 2016 | $2,990 | $114,483 | $27,146 | $87,337 |
| 2015 | $2,985 | $101,438 | $22,197 | $79,241 |
| 2014 | $2,890 | $98,582 | $24,255 | $74,327 |
| 2013 | -- | $74,585 | $18,620 | $55,965 |
Source: Public Records
Map
Nearby Homes
- 4383 Setting Sun Ct Unit 1
- 4601 N Cactus Hills Ct
- 1850 Almonte Ct
- 2411 Tecumseh Way Unit 12
- 2415 Tecumseh Way
- 2427 Tecumseh Way Unit 8
- 2738 Kettle Ct
- 4393 Acobat Ct
- 4675 Firtree Ln
- 4677 High Pass Ct
- 1685 Southview Dr
- 2316 Isabella Ct
- 2575 Piero Ct
- 4797 High Pass Dr
- 3353 Culpepper Dr
- 3375 Culpepper Dr
- 1550 Istrice Rd
- 2631 Michelangelo Ct
- 1560 Freeman Way
- 1557 Satellite Dr
- 4376 Dancing Moon Way Unit 1
- 4410 Dancing Moon Ct Unit 1
- 4362 Dancing Moon Way
- 4391 Desert Highlands Dr
- 4389 Dancing Moon Way
- 4383 Desert Highlands Dr
- 4395 Dancing Moon Way
- 4415 Desert Highlands Dr
- 4348 Dancing Moon Way
- 4420 Dancing Moon Ct
- 4405 Dancing Moon Ct
- 4375 Dancing Moon Way Unit 1
- 4361 Dancing Moon Way Unit 1
- 4375 Desert Highlands Dr
- 4334 Dancing Moon Way
- 4367 Desert Highlands Dr
- 4435 Desert Highlands Dr
- 4415 Dancing Moon Ct
- 4430 Dancing Moon Ct
- 4347 Dancing Moon Way Unit 1