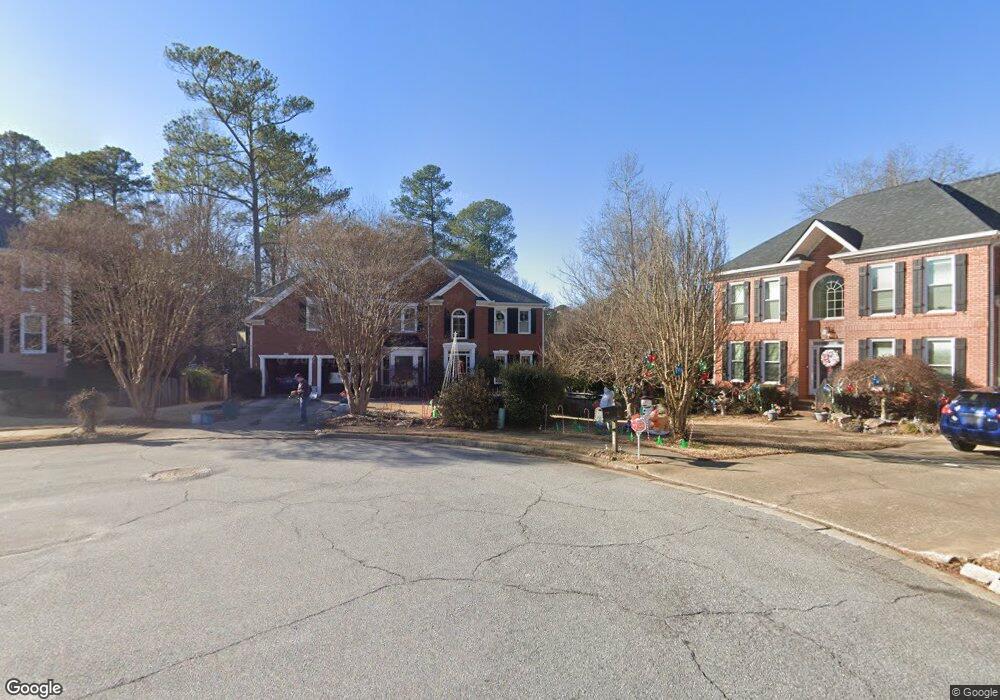
4390 Dovershire Dr Norcross, GA 30092
Estimated Value: $690,000 - $775,000
4
Beds
3
Baths
3,135
Sq Ft
$233/Sq Ft
Est. Value
About This Home
This home is located at 4390 Dovershire Dr, Norcross, GA 30092 and is currently estimated at $729,081, approximately $232 per square foot. 4390 Dovershire Dr is a home located in Gwinnett County with nearby schools including Simpson Elementary School, Pinckneyville Middle School, and Norcross High School.
Ownership History
Date
Name
Owned For
Owner Type
Purchase Details
Closed on
May 25, 2000
Sold by
Hain Timothy J
Bought by
Sapough Kevin C and Sapough Jessica Kv
Current Estimated Value
Home Financials for this Owner
Home Financials are based on the most recent Mortgage that was taken out on this home.
Original Mortgage
$222,000
Outstanding Balance
$76,694
Interest Rate
8.14%
Mortgage Type
New Conventional
Estimated Equity
$652,387
Purchase Details
Closed on
Feb 26, 1999
Sold by
Selig Stanley H and Selig Susan O
Bought by
Hain Timothy J and Uhe Shawn
Home Financials for this Owner
Home Financials are based on the most recent Mortgage that was taken out on this home.
Original Mortgage
$183,750
Interest Rate
6.79%
Mortgage Type
New Conventional
Purchase Details
Closed on
Jul 30, 1993
Sold by
Colonnade Homes Lp
Bought by
Selig Stanley H Susan
Home Financials for this Owner
Home Financials are based on the most recent Mortgage that was taken out on this home.
Original Mortgage
$186,550
Interest Rate
7.34%
Create a Home Valuation Report for This Property
The Home Valuation Report is an in-depth analysis detailing your home's value as well as a comparison with similar homes in the area
Home Values in the Area
Average Home Value in this Area
Purchase History
| Date | Buyer | Sale Price | Title Company |
|---|---|---|---|
| Sapough Kevin C | $282,000 | -- | |
| Hain Timothy J | $245,000 | -- | |
| Selig Stanley H Susan | $207,300 | -- |
Source: Public Records
Mortgage History
| Date | Status | Borrower | Loan Amount |
|---|---|---|---|
| Open | Sapough Kevin C | $222,000 | |
| Previous Owner | Hain Timothy J | $183,750 | |
| Previous Owner | Selig Stanley H Susan | $186,550 |
Source: Public Records
Tax History Compared to Growth
Tax History
| Year | Tax Paid | Tax Assessment Tax Assessment Total Assessment is a certain percentage of the fair market value that is determined by local assessors to be the total taxable value of land and additions on the property. | Land | Improvement |
|---|---|---|---|---|
| 2024 | $6,649 | $254,360 | $50,400 | $203,960 |
| 2023 | $6,649 | $228,400 | $44,000 | $184,400 |
| 2022 | $5,618 | $203,840 | $36,000 | $167,840 |
| 2021 | $4,946 | $166,040 | $35,520 | $130,520 |
| 2020 | $4,982 | $166,040 | $35,520 | $130,520 |
| 2019 | $4,849 | $165,520 | $30,000 | $135,520 |
| 2018 | $4,868 | $165,520 | $30,000 | $135,520 |
| 2016 | $4,277 | $140,000 | $32,000 | $108,000 |
| 2015 | $4,317 | $140,000 | $32,000 | $108,000 |
| 2014 | -- | $127,760 | $38,360 | $89,400 |
Source: Public Records
Map
Nearby Homes
- 5221 W Jones Bridge Rd
- 5350 Wickershire Dr
- 5354 Fox Hill Dr
- 5194 Sunburst Dr
- 4531 Outer Bank Dr
- 5465 Fort Fisher Way
- 4477 Watervale Way Unit 286
- 5059 Shirley Oaks Dr Unit 309
- 5124 Bandolino Ln Unit 323
- 4479 Watervale Way Unit 285
- 4487 Watervale Way Unit 283
- 4489 Watervale Way Unit 282
- The Grayson II Plan at Waterside - Townhomes
- 5049 Shirley Oaks Dr Unit 312
- 4916 Sudbrook Way Unit 253
- 4903 Sudbrook Way Unit 239
- 4380 Dovershire Dr
- 4400 Dovershire Dr
- 0 Dovershire Dr Unit 7490044
- 5368 Broadwood Ave
- 5358 Broadwood Ave
- 4395 Dovershire Dr
- 5201 W Jones Bridge Rd
- 5348 Broadwood Ave
- 5335 Wickershire Dr
- 5211 W Jones Bridge Rd Unit 19
- 5211 W Jones Bridge Rd
- 5211 W West Jones Bridge Rd Unit 19
- 5355 Wickershire Dr
- 4388 Wickershire Way
- 5376 Valley Mist Ct
- 5325 Wickershire Dr
- 5338 Broadwood Ave
- 4398 Wickershire Way
- 5369 Broadwood Ave
- 5340 Wickershire Dr