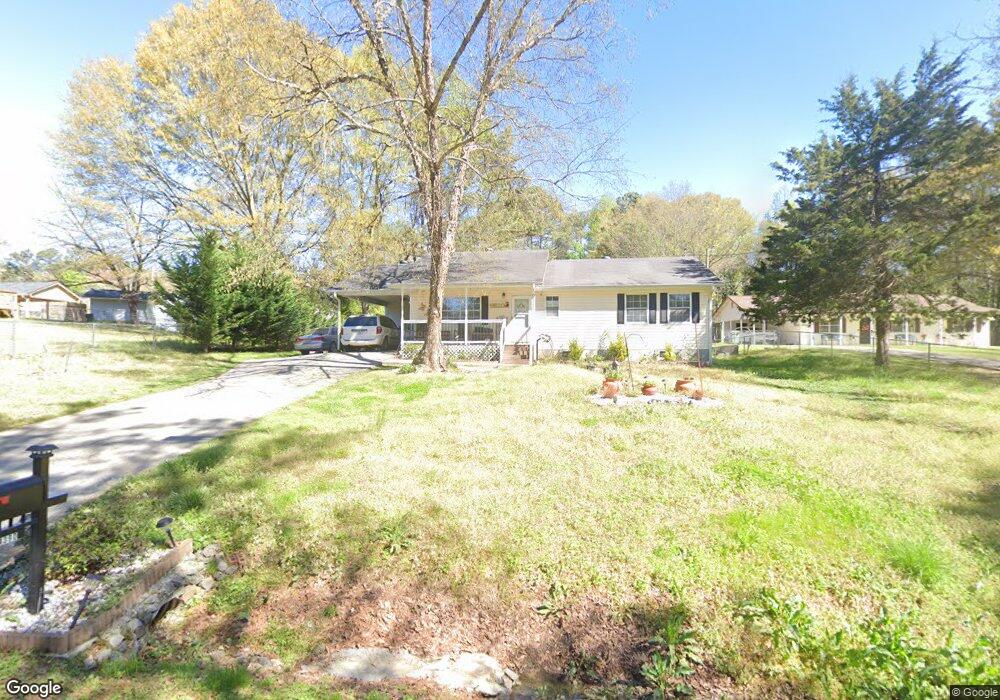
4390 N Giles Rd Douglasville, GA 30134
Estimated Value: $229,000 - $269,000
3
Beds
2
Baths
1,292
Sq Ft
$193/Sq Ft
Est. Value
About This Home
This home is located at 4390 N Giles Rd, Douglasville, GA 30134 and is currently estimated at $249,017, approximately $192 per square foot. 4390 N Giles Rd is a home located in Douglas County with nearby schools including Eastside Elementary School, Chestnut Log Middle School, and Lithia Springs Comprehensive High School.
Ownership History
Date
Name
Owned For
Owner Type
Purchase Details
Closed on
Apr 11, 2016
Sold by
Agan Starling Chalmus
Bought by
Childers Jeffrey S and Childers Pamela L
Current Estimated Value
Purchase Details
Closed on
Aug 13, 2015
Sold by
Childers Jeffrey Scott
Bought by
Agan Starling Chalmus and Agan Clarice D
Purchase Details
Closed on
Dec 27, 2002
Sold by
Stevens Bryan T and Stevens Ruby V
Bought by
Agan Starling C and Agan Clarice D
Home Financials for this Owner
Home Financials are based on the most recent Mortgage that was taken out on this home.
Original Mortgage
$85,500
Interest Rate
5.93%
Mortgage Type
New Conventional
Purchase Details
Closed on
Sep 9, 1994
Sold by
Nwp Prop
Bought by
Stevens Bryan T and Stevens Roby V
Home Financials for this Owner
Home Financials are based on the most recent Mortgage that was taken out on this home.
Original Mortgage
$56,327
Interest Rate
8.53%
Create a Home Valuation Report for This Property
The Home Valuation Report is an in-depth analysis detailing your home's value as well as a comparison with similar homes in the area
Home Values in the Area
Average Home Value in this Area
Purchase History
| Date | Buyer | Sale Price | Title Company |
|---|---|---|---|
| Childers Jeffrey S | -- | -- | |
| Agan Starling Chalmus | -- | -- | |
| Agan Starling Chalmus | -- | -- | |
| Agan Starling C | $85,000 | -- | |
| Stevens Bryan T | $55,000 | -- |
Source: Public Records
Mortgage History
| Date | Status | Borrower | Loan Amount |
|---|---|---|---|
| Previous Owner | Agan Starling C | $85,500 | |
| Previous Owner | Stevens Bryan T | $56,327 |
Source: Public Records
Tax History Compared to Growth
Tax History
| Year | Tax Paid | Tax Assessment Tax Assessment Total Assessment is a certain percentage of the fair market value that is determined by local assessors to be the total taxable value of land and additions on the property. | Land | Improvement |
|---|---|---|---|---|
| 2024 | $1,607 | $51,080 | $9,800 | $41,280 |
| 2023 | $1,607 | $51,080 | $9,800 | $41,280 |
| 2022 | $1,663 | $51,080 | $9,800 | $41,280 |
| 2021 | $1,341 | $41,120 | $9,800 | $31,320 |
| 2020 | $1,364 | $41,120 | $9,800 | $31,320 |
| 2019 | $999 | $32,280 | $7,840 | $24,440 |
| 2018 | $974 | $31,320 | $7,840 | $23,480 |
| 2017 | $906 | $28,560 | $7,840 | $20,720 |
| 2016 | $856 | $26,520 | $7,440 | $19,080 |
| 2015 | $848 | $25,720 | $7,440 | $18,280 |
| 2014 | $827 | $24,600 | $7,640 | $16,960 |
| 2013 | -- | $22,000 | $6,840 | $15,160 |
Source: Public Records
Map
Nearby Homes
- 1550 Oxford St
- 4385 Midway Rd
- 4037 Regent St
- 4257 Midway Rd
- 4311 Short St
- 3948 Regent St
- 1684 Dogwood Trail
- 4370 Clearview Dr
- 4239 Midway Dr
- 4229 Midway Dr
- 4229 Clearview Dr
- 5501 Somer Ridge Ct
- 0 Scott Dr Unit 7532624
- 0 Scott Dr Unit 10468599
- 8108 Fieldstream Way
- 8113 Fieldstream Way
- 3003 Acacia Cir
- 5000 Elowen Ln
- 8053 Duralee Ln
- 4170 Newman Ellis Rd
- 4364 Midway Rd
- 4366 Midway Rd
- 4370 Midway Rd
- 4370 N Giles Rd
- 4360 Midway Rd
- 4382 Midway Rd
- 4361 Midway Rd
- 4276 N Giles Rd
- 4384 Midway Rd
- 4348 Midway Rd
- 1581 Crown St
- 4375 Midway Rd
- 4347 Midway Rd
- 4273 N Giles Rd Unit 1
- 4377 Midway Rd
- 1621 Patricia Ln
- 4328 Midway Rd
- 1540 Oxford St
- 4379 Midway Rd
- 4386 Midway Rd