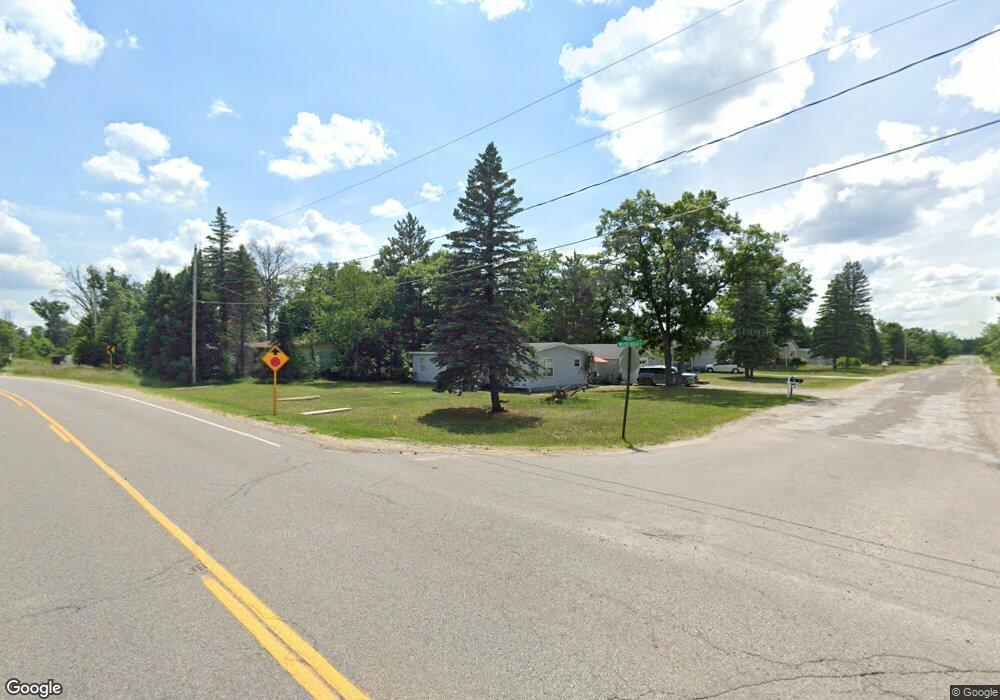
4390 W Pinecrest Rd Grayling, MI 49738
Estimated Value: $123,518 - $144,000
3
Beds
2
Baths
1,040
Sq Ft
$125/Sq Ft
Est. Value
About This Home
This home is located at 4390 W Pinecrest Rd, Grayling, MI 49738 and is currently estimated at $130,380, approximately $125 per square foot. 4390 W Pinecrest Rd is a home located in Crawford County with nearby schools including Grayling Elementary School, Grayling Middle School, and Grayling High School.
Ownership History
Date
Name
Owned For
Owner Type
Purchase Details
Closed on
Oct 17, 2023
Sold by
Mortgage Investment Inc
Bought by
Wood Meghan E
Current Estimated Value
Home Financials for this Owner
Home Financials are based on the most recent Mortgage that was taken out on this home.
Original Mortgage
$8,160
Outstanding Balance
$7,994
Interest Rate
7.19%
Mortgage Type
New Conventional
Estimated Equity
$122,386
Purchase Details
Closed on
Apr 7, 2008
Bought by
Mortgage Investment Inc.
Purchase Details
Closed on
Apr 3, 2007
Bought by
Federal National Mortgage Assoc
Purchase Details
Closed on
Mar 19, 2007
Bought by
Federal National Mortgage Ass
Purchase Details
Closed on
Jan 17, 2007
Bought by
Mortgage Elec. Registration Sys Inc
Purchase Details
Closed on
Jan 11, 2007
Sold by
Cross Renee
Bought by
Mers, Inc
Purchase Details
Closed on
Jun 16, 2004
Sold by
Swiercz Mark and Swiercz Deanne
Bought by
Cross Renee
Create a Home Valuation Report for This Property
The Home Valuation Report is an in-depth analysis detailing your home's value as well as a comparison with similar homes in the area
Home Values in the Area
Average Home Value in this Area
Purchase History
| Date | Buyer | Sale Price | Title Company |
|---|---|---|---|
| Wood Meghan E | $100,000 | -- | |
| Mortgage Investment Inc. | $27,300 | -- | |
| Federal National Mortgage Assoc | -- | -- | |
| Federal National Mortgage Ass | -- | -- | |
| Mortgage Elec. Registration Sys Inc | $54,100 | -- | |
| Mers, Inc | $54,100 | -- | |
| Cross Renee | $8,000 | -- |
Source: Public Records
Mortgage History
| Date | Status | Borrower | Loan Amount |
|---|---|---|---|
| Open | Wood Meghan E | $8,160 | |
| Open | Wood Meghan E | $98,188 |
Source: Public Records
Tax History
| Year | Tax Paid | Tax Assessment Tax Assessment Total Assessment is a certain percentage of the fair market value that is determined by local assessors to be the total taxable value of land and additions on the property. | Land | Improvement |
|---|---|---|---|---|
| 2025 | $772 | $50,700 | $4,000 | $46,700 |
| 2024 | $755 | $44,600 | $4,000 | $40,600 |
| 2023 | $629 | $24,900 | $4,000 | $20,900 |
| 2022 | $598 | $22,800 | $4,000 | $18,800 |
| 2021 | $784 | $19,700 | $4,000 | $15,700 |
| 2020 | $775 | $17,300 | $4,000 | $13,300 |
| 2019 | $759 | $16,600 | $4,000 | $12,600 |
| 2018 | $744 | $15,600 | $4,000 | $11,600 |
| 2017 | $809 | $27,100 | $4,000 | $23,100 |
| 2016 | $802 | $25,500 | $25,500 | $0 |
| 2015 | $985 | $25,500 | $0 | $0 |
| 2014 | -- | $21,000 | $0 | $0 |
| 2013 | -- | $21,200 | $0 | $0 |
Source: Public Records
Map
Nearby Homes
- 4079 W Pinecrest Rd
- 3866 Wintergreen Ln
- 1205 E Michigan Ave
- 4593 Orbit Dr
- 403 Erie St
- 1024 S I-75 Business Loop
- 610 Spruce St
- 4869 N Brighton Cir
- 601 Peninsular Ave
- 110 State St
- 300 Rolla St
- 000 W M-72 Hwy
- V/L L71-75 Evergreen Dr
- Lot 82 Evelyn Ave
- 5973 W M-72 Hwy
- 2706 Newatch Ave
- 6960 Trem Pal Rd
- 2698 Newatch Ave
- 6324 W Pine Point Rd
- 6110 Alex Rd
- 4366 W Pinecrest Rd
- 4395 W Pinecrest Rd
- 4367 W Pinecrest Rd
- 4343 W Pinecrest Rd
- 404 Alexia Ln
- 405 Alexia Ln
- 4327 W Pinecrest Rd
- 402 Alexia Ln
- 4315 W Pinecrest Rd
- 400 Alexia Ln
- 308 Alexia Ln
- 4304 W Pinecrest Rd
- 401 Alexia Ln
- 4289 W Pinecrest Rd
- 4263 W Pinecrest Rd
- 4263 W Pinecrest Rd Unit Lot 21
- 306 Alexia Ln
- 4275 W Pinecrest Rd
- 235 Crestwood Dr
- 304 Alexia Ln
Your Personal Tour Guide
Ask me questions while you tour the home.