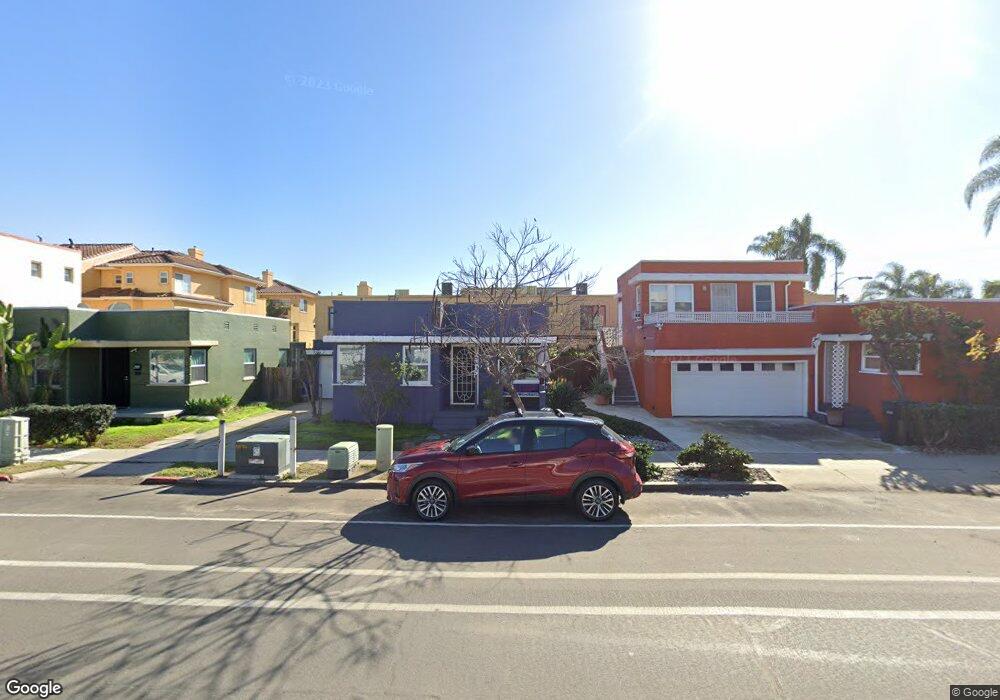
4391 Kansas St Unit U2 San Diego, CA 92104
North Park NeighborhoodEstimated Value: $1,157,000 - $1,232,000
2
Beds
2
Baths
1,204
Sq Ft
$992/Sq Ft
Est. Value
About This Home
This home is located at 4391 Kansas St Unit U2, San Diego, CA 92104 and is currently estimated at $1,194,016, approximately $991 per square foot. 4391 Kansas St Unit U2 is a home located in San Diego County with nearby schools including Garfield Elementary, Roosevelt International Middle School, and North Park Christian School.
Ownership History
Date
Name
Owned For
Owner Type
Purchase Details
Closed on
Mar 10, 2006
Sold by
Hepler Thomas G
Bought by
Hepler Thomas G
Current Estimated Value
Purchase Details
Closed on
Dec 19, 2001
Sold by
Faber Mark
Bought by
Weimer Robbin Lane
Home Financials for this Owner
Home Financials are based on the most recent Mortgage that was taken out on this home.
Original Mortgage
$165,000
Outstanding Balance
$64,187
Interest Rate
6.51%
Mortgage Type
Seller Take Back
Estimated Equity
$1,129,829
Purchase Details
Closed on
Dec 12, 2000
Sold by
Faber Mark and Werner Marc D
Bought by
Hepler Thomas G
Home Financials for this Owner
Home Financials are based on the most recent Mortgage that was taken out on this home.
Original Mortgage
$125,000
Interest Rate
7.81%
Purchase Details
Closed on
May 1, 1998
Sold by
Mark Faber
Bought by
Faber Mark and Werner Marc D
Create a Home Valuation Report for This Property
The Home Valuation Report is an in-depth analysis detailing your home's value as well as a comparison with similar homes in the area
Home Values in the Area
Average Home Value in this Area
Purchase History
| Date | Buyer | Sale Price | Title Company |
|---|---|---|---|
| Hepler Thomas G | -- | None Available | |
| Weimer Robbin Lane | $175,000 | Commonwealth Land Title Co | |
| Faber Mark | -- | Commonwealth Land Title Co | |
| Hepler Thomas G | $275,000 | Commonwealth Land Title Co | |
| Faber Mark | -- | -- |
Source: Public Records
Mortgage History
| Date | Status | Borrower | Loan Amount |
|---|---|---|---|
| Open | Weimer Robbin Lane | $165,000 | |
| Previous Owner | Hepler Thomas G | $125,000 | |
| Closed | Hepler Thomas G | $50,000 |
Source: Public Records
Tax History Compared to Growth
Tax History
| Year | Tax Paid | Tax Assessment Tax Assessment Total Assessment is a certain percentage of the fair market value that is determined by local assessors to be the total taxable value of land and additions on the property. | Land | Improvement |
|---|---|---|---|---|
| 2025 | $4,961 | $414,363 | $286,290 | $128,073 |
| 2024 | $4,961 | $406,239 | $280,677 | $125,562 |
| 2023 | $4,849 | $398,274 | $275,174 | $123,100 |
| 2022 | $4,718 | $390,466 | $269,779 | $120,687 |
| 2021 | $4,683 | $382,811 | $264,490 | $118,321 |
| 2020 | $4,625 | $378,886 | $261,778 | $117,108 |
| 2019 | $4,541 | $371,458 | $256,646 | $114,812 |
| 2018 | $4,246 | $364,175 | $251,614 | $112,561 |
| 2017 | $4,143 | $357,035 | $246,681 | $110,354 |
| 2016 | $4,075 | $350,036 | $241,845 | $108,191 |
| 2015 | $4,013 | $344,779 | $238,213 | $106,566 |
| 2014 | $3,949 | $338,026 | $233,547 | $104,479 |
Source: Public Records
Map
Nearby Homes
- 4355 Utah St Unit 2
- 4347 30th St Unit 53
- 4432 Kansas St Unit C
- 4366 Ohio St
- 4367 Idaho St Unit 5
- 4473 30th St Unit 506
- 4473 30th St Unit 218
- 4473 30th St Unit 505
- 4473 30th St Unit 402
- 4226 Utah St
- 4381 Oregon St Unit 6
- 4205 Ohio St Unit 204
- 4205 Ohio St Unit 106
- 4153-55 Utah St
- 4119-23 Kansas
- 4074 30th St
- 4075 Idaho St Unit 2
- 4486 32nd St
- 4043 Utah St Unit 3
- 4657 Idaho St
- 2919 Meade Ave
- 2915 Meade Ave
- 4383 Kansas St
- 4383 Kansas St Unit 6
- 4383 Kansas St Unit 7
- 4383 Kansas St Unit 4
- 4383 Kansas St Unit 3
- 4383 Kansas St Unit 2
- 4383 Kansas St Unit 1
- 4373 Kansas St Unit 77
- 2910 Meade Ave
- 4371 Kansas St
- 2900 Meade Ave Unit 4
- 2914 Meade Ave
- 4413 Kansas St
- 4409 Kansas St
- 4407 Kansas St
- 4405 Kansas St
- 4411 Kansas St
- 4361 Kansas St Unit 67