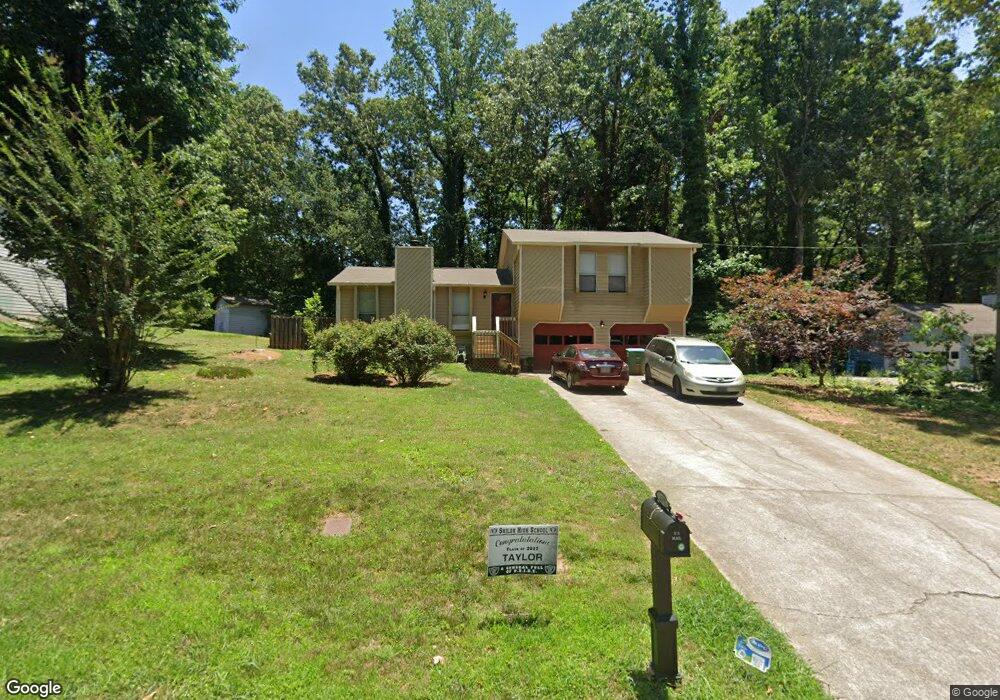
4392 Hidden Bluff Way Snellville, GA 30039
Estimated Value: $280,000 - $313,000
3
Beds
2
Baths
1,423
Sq Ft
$207/Sq Ft
Est. Value
About This Home
This home is located at 4392 Hidden Bluff Way, Snellville, GA 30039 and is currently estimated at $294,841, approximately $207 per square foot. 4392 Hidden Bluff Way is a home located in Gwinnett County with nearby schools including Annistown Elementary School, Shiloh Middle School, and Shiloh High School.
Ownership History
Date
Name
Owned For
Owner Type
Purchase Details
Closed on
Apr 3, 2025
Sold by
Chambliss Demond L
Bought by
Chambliss Demond Trust and Chambliss Demond
Current Estimated Value
Purchase Details
Closed on
Apr 26, 2002
Sold by
Stassfort Zella S and Stassfort Derrick H
Bought by
Chambliss Demond L and Chambliss Yvonne M
Home Financials for this Owner
Home Financials are based on the most recent Mortgage that was taken out on this home.
Original Mortgage
$119,900
Interest Rate
7.16%
Mortgage Type
New Conventional
Purchase Details
Closed on
Mar 27, 2001
Sold by
Stassfort Zella S
Bought by
Stassfort Zella S and Stassfort Derrick H
Purchase Details
Closed on
Mar 14, 1995
Sold by
Southtrust Bank Ga Na
Bought by
Stassfort Zella S
Purchase Details
Closed on
May 14, 1993
Sold by
Lark David A Susan A
Bought by
Ramsey Linda C
Home Financials for this Owner
Home Financials are based on the most recent Mortgage that was taken out on this home.
Original Mortgage
$74,050
Interest Rate
7.43%
Mortgage Type
FHA
Create a Home Valuation Report for This Property
The Home Valuation Report is an in-depth analysis detailing your home's value as well as a comparison with similar homes in the area
Home Values in the Area
Average Home Value in this Area
Purchase History
| Date | Buyer | Sale Price | Title Company |
|---|---|---|---|
| Chambliss Demond Trust | -- | -- | |
| Chambliss Demond L | $119,900 | -- | |
| Stassfort Zella S | -- | -- | |
| Stassfort Zella S | $74,800 | -- | |
| Ramsey Linda C | $75,200 | -- |
Source: Public Records
Mortgage History
| Date | Status | Borrower | Loan Amount |
|---|---|---|---|
| Previous Owner | Chambliss Demond L | $119,900 | |
| Previous Owner | Ramsey Linda C | $74,050 |
Source: Public Records
Tax History Compared to Growth
Tax History
| Year | Tax Paid | Tax Assessment Tax Assessment Total Assessment is a certain percentage of the fair market value that is determined by local assessors to be the total taxable value of land and additions on the property. | Land | Improvement |
|---|---|---|---|---|
| 2024 | $3,128 | $110,560 | $23,720 | $86,840 |
| 2023 | $3,128 | $100,440 | $23,600 | $76,840 |
| 2022 | $2,580 | $85,920 | $23,600 | $62,320 |
| 2021 | $2,170 | $65,040 | $19,600 | $45,440 |
| 2020 | $2,088 | $60,640 | $14,000 | $46,640 |
| 2019 | $2,031 | $60,640 | $14,000 | $46,640 |
| 2018 | $1,848 | $52,320 | $9,600 | $42,720 |
| 2016 | $1,484 | $38,760 | $9,600 | $29,160 |
| 2015 | $1,322 | $33,880 | $6,000 | $27,880 |
| 2014 | $1,327 | $33,880 | $6,000 | $27,880 |
Source: Public Records
Map
Nearby Homes
- 3328 Hidden Bluff Trail
- 4287 Meadow Wind Dr SW
- 4410 Ross Estates Ct
- 3032 Ross Rd
- 4227 Meadow Wind Dr SW
- 3209 Moon Stone Ln
- 4604 Shumart Dr
- 3041 Cadbury Trail
- 3024 Bridgehaven Ct
- 3462 Johnson Dr
- 3536 Hadley Place
- 4196 Jami Ln
- 2982 Moorings Pkwy Unit 1
- 4389 & 4381 Campbell Rd
- 1570 Stacy Dr Unit Lot 6
- 1560 Stacy Dr
- 1570 Stacy Dr
- 4339 Donerail Dr
- 4002 Zoar Church Rd
- 4402 Hidden Bluff Way
- 4372 Hidden Bluff Way
- 3239 Hidden Bluff Trail
- 0 Hidden Bluff Way Unit 7410644
- 3249 Hidden Bluff Trail
- 4412 Hidden Bluff Way
- 4352 Hidden Bluff Way
- 4391 Hidden Bluff Way Unit 4391
- 4391 Hidden Bluff Way
- 4401 Hidden Bluff Way
- 4381 Hidden Bluff Way
- 3259 Hidden Bluff Trail
- 4422 Hidden Bluff Way
- 4411 Hidden Bluff Way
- 4371 Hidden Bluff Way
- 4431 Hidden Bluff Way
- 4361 Hidden Bluff Way
- 3228 Hidden Bluff Trail
- 3209 Hidden Bluff Trail
- 3299 Hidden Bluff Trail