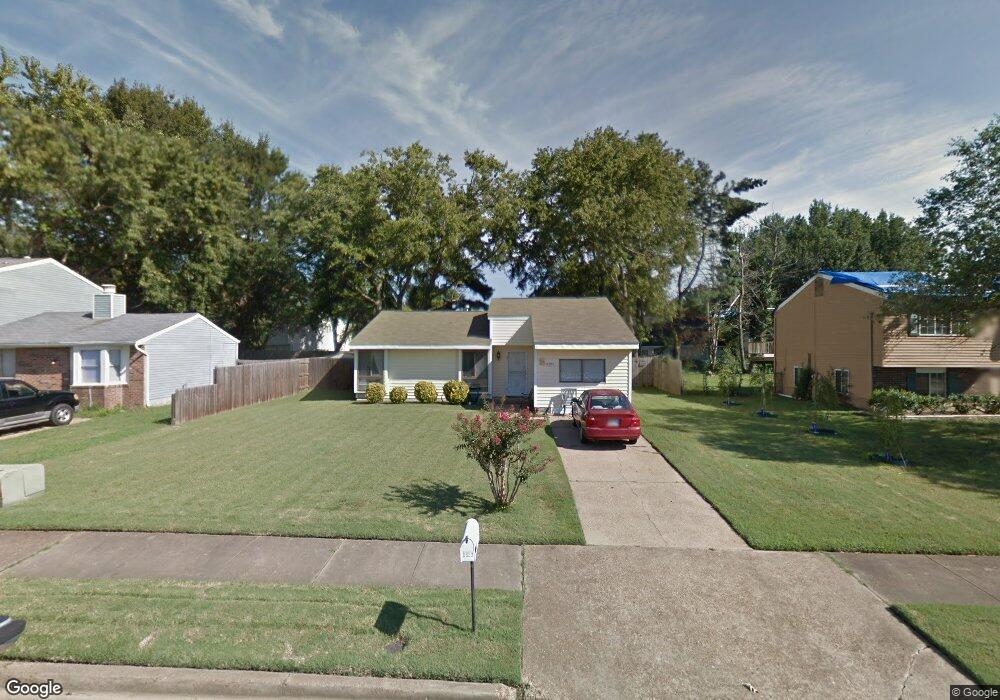
4394 Duncan Rd Millington, TN 38053
Estimated Value: $179,000 - $200,000
3
Beds
2
Baths
1,391
Sq Ft
$135/Sq Ft
Est. Value
About This Home
This home is located at 4394 Duncan Rd, Millington, TN 38053 and is currently estimated at $188,268, approximately $135 per square foot. 4394 Duncan Rd is a home located in Shelby County with nearby schools including Lucy Elementary School, Woodstock Middle School, and Bolton High School.
Ownership History
Date
Name
Owned For
Owner Type
Purchase Details
Closed on
Nov 1, 2019
Sold by
Curley Becky and Taylor Becky Colleen
Bought by
Bohatch Jenny M
Current Estimated Value
Home Financials for this Owner
Home Financials are based on the most recent Mortgage that was taken out on this home.
Original Mortgage
$57,600
Outstanding Balance
$50,774
Interest Rate
3.7%
Mortgage Type
New Conventional
Estimated Equity
$137,494
Purchase Details
Closed on
Nov 13, 2008
Sold by
Taylor Michael Dewayne and Taylor Becky Colleen
Bought by
Taylor Becky Colleen
Purchase Details
Closed on
Jan 23, 2001
Sold by
Moranville Beverly Jacks and Moranville Doran
Bought by
Taylor Michael and Taylor Becky
Home Financials for this Owner
Home Financials are based on the most recent Mortgage that was taken out on this home.
Original Mortgage
$24,600
Interest Rate
7.44%
Create a Home Valuation Report for This Property
The Home Valuation Report is an in-depth analysis detailing your home's value as well as a comparison with similar homes in the area
Home Values in the Area
Average Home Value in this Area
Purchase History
| Date | Buyer | Sale Price | Title Company |
|---|---|---|---|
| Bohatch Jenny M | $72,000 | None Available | |
| Taylor Becky Colleen | -- | None Available | |
| Taylor Michael | $82,000 | -- |
Source: Public Records
Mortgage History
| Date | Status | Borrower | Loan Amount |
|---|---|---|---|
| Open | Bohatch Jenny M | $57,600 | |
| Previous Owner | Taylor Michael | $24,600 | |
| Closed | Taylor Michael | $57,400 |
Source: Public Records
Tax History Compared to Growth
Tax History
| Year | Tax Paid | Tax Assessment Tax Assessment Total Assessment is a certain percentage of the fair market value that is determined by local assessors to be the total taxable value of land and additions on the property. | Land | Improvement |
|---|---|---|---|---|
| 2025 | $890 | $42,875 | $5,000 | $37,875 |
| 2024 | $890 | $26,250 | $3,725 | $22,525 |
| 2023 | $890 | $26,250 | $3,725 | $22,525 |
| 2022 | $890 | $26,250 | $3,725 | $22,525 |
| 2021 | $906 | $26,250 | $3,725 | $22,525 |
| 2020 | $704 | $17,375 | $3,725 | $13,650 |
| 2019 | $0 | $17,375 | $3,725 | $13,650 |
| 2018 | $704 | $17,375 | $3,725 | $13,650 |
| 2017 | $714 | $17,375 | $3,725 | $13,650 |
| 2016 | $761 | $17,425 | $0 | $0 |
| 2014 | $761 | $17,425 | $0 | $0 |
Source: Public Records
Map
Nearby Homes
- 4385 Ridge Bay Cove
- 4392 Ridge Bay Cove
- 4428 Duncan Rd
- 5975 Prairie Cove
- 4551 Waverly Farms Rd
- 4578 Basun Cir E
- 6866 Basun Cir E
- 4140 Pleasant Ridge Rd
- 3545 Lucy Rd
- 4235 Sykes Rd
- 4036 Hinge Gate Ln
- 4062 Hinge Gate Ln
- 4050 Hinge Gate Ln
- 4600 Goldsby Place
- 4746 Royal View Dr
- 4709 Old Raleigh Millington Rd
- 4768 Royal Ridge Dr
- 4693 Waterfront Oak Dr
- 4563 Blue River Dr
- 4757 Bluff Wood Cove
- 4398 Duncan Rd
- 4386 Duncan Rd
- 4393 Ridge Bay Cove
- 4378 Duncan Rd
- 4408 Duncan Rd
- 4399 Ridge Bay Cove
- 4407 Ridge Bay Cove
- 4414 Duncan Rd
- 4370 Duncan Rd
- 4415 Ridge Bay Cove
- 5744 Northland Dr
- 4382 Ridge Bay Cove
- 5748 Northland Dr
- 4420 Duncan Rd
- 4421 Ridge Bay Cove
- 4398 Ridge Bay Cove
- 5756 Northland Dr
- 4386 Ridge Bay Cove
- 4406 Ridge Bay Cove
- 4414 Ridge Bay Cove