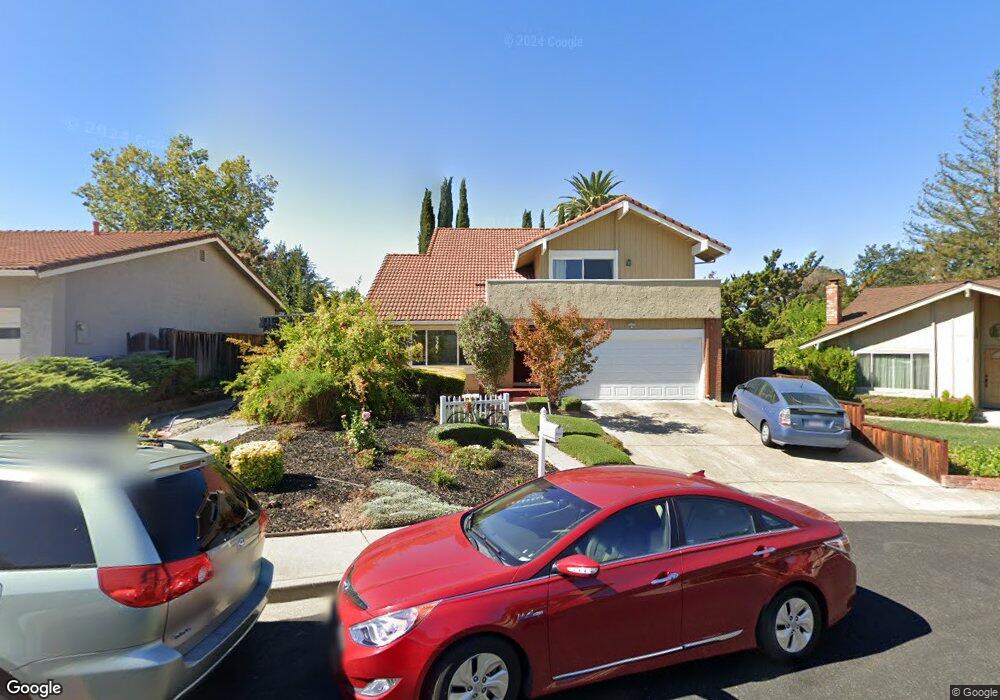
4394 N Weeping Spruce Ct Concord, CA 94521
Midtown Concord NeighborhoodEstimated Value: $997,840 - $1,095,000
4
Beds
3
Baths
2,129
Sq Ft
$493/Sq Ft
Est. Value
About This Home
This home is located at 4394 N Weeping Spruce Ct, Concord, CA 94521 and is currently estimated at $1,049,210, approximately $492 per square foot. 4394 N Weeping Spruce Ct is a home located in Contra Costa County with nearby schools including Highlands Elementary School, Mt. Diablo Elementary School, and Foothill Middle School.
Ownership History
Date
Name
Owned For
Owner Type
Purchase Details
Closed on
Apr 3, 2008
Sold by
Madra Rakesh and Madra Nita
Bought by
Madra Rakesh and Madra Nita
Current Estimated Value
Purchase Details
Closed on
Apr 24, 1996
Sold by
Thiel Stephen P and Thiel Venus H
Bought by
Madra Rakesh and Madra Nita
Home Financials for this Owner
Home Financials are based on the most recent Mortgage that was taken out on this home.
Original Mortgage
$196,400
Outstanding Balance
$9,662
Interest Rate
7.82%
Mortgage Type
Purchase Money Mortgage
Estimated Equity
$1,039,548
Create a Home Valuation Report for This Property
The Home Valuation Report is an in-depth analysis detailing your home's value as well as a comparison with similar homes in the area
Home Values in the Area
Average Home Value in this Area
Purchase History
| Date | Buyer | Sale Price | Title Company |
|---|---|---|---|
| Madra Rakesh | -- | None Available | |
| Madra Rakesh | $245,500 | Fidelity National Title Co | |
| Madra Rakesh | -- | Fidelity National Title |
Source: Public Records
Mortgage History
| Date | Status | Borrower | Loan Amount |
|---|---|---|---|
| Open | Madra Rakesh | $196,400 |
Source: Public Records
Tax History Compared to Growth
Tax History
| Year | Tax Paid | Tax Assessment Tax Assessment Total Assessment is a certain percentage of the fair market value that is determined by local assessors to be the total taxable value of land and additions on the property. | Land | Improvement |
|---|---|---|---|---|
| 2025 | $5,287 | $407,811 | $124,576 | $283,235 |
| 2024 | $5,176 | $399,816 | $122,134 | $277,682 |
| 2023 | $5,176 | $391,978 | $119,740 | $272,238 |
| 2022 | $5,094 | $384,293 | $117,393 | $266,900 |
| 2021 | $4,960 | $376,759 | $115,092 | $261,667 |
| 2019 | $4,856 | $365,585 | $111,679 | $253,906 |
| 2018 | $4,665 | $358,418 | $109,490 | $248,928 |
| 2017 | $4,502 | $351,392 | $107,344 | $244,048 |
| 2016 | $4,365 | $344,503 | $105,240 | $239,263 |
| 2015 | $4,301 | $339,330 | $103,660 | $235,670 |
| 2014 | $4,213 | $332,684 | $101,630 | $231,054 |
Source: Public Records
Map
Nearby Homes
- 4495 Wildberry Ct
- 4317 Cowell Rd
- 4403 Winterberry Ct
- 4380 Saint Charles Place
- 4597 Wildcat Ln
- 4398 N Canoe Birch Ct
- 1450 Bel Air Dr Unit 110
- 4362 Lynn Dr
- 1459 Wharton Way Unit C
- 1158 Saint Matthew Place Unit 107
- 4655 Melody Dr Unit A
- 4119 Churchill Dr
- 1435 Bel Air Dr Unit C
- 4490 Buckthorn Ct
- 1455 Latour Ln Unit 43
- 4058 Treat Blvd
- 1337 Cape Cod Way
- 1187 Kaski Ln
- 4044 Cowell Rd
- 1381 Rosal Ln
- 4396 N Weeping Spruce Ct
- 4392 N Weeping Spruce Ct
- 4393 N Prairie Willow Ct
- 4395 N Prairie Willow Ct
- 4391 N Prairie Willow Ct
- 4390 N Weeping Spruce Ct
- 4393 N Weeping Spruce Ct
- 4395 N Weeping Spruce Ct
- 4391 N Weeping Spruce Ct
- 4400 Weeping Spruce Ct
- 4390 N Prairie Willow Ct
- 4401 Prairie Willow Ct
- 4401 Weeping Spruce Ct
- 4394 N Prairie Willow Ct
- 4402 Weeping Spruce Ct
- 4394 N Marsh Elder Ct
- 4396 N Prairie Willow Ct
- 1352 Bent Tree Ln
- 4396 N Marsh Elder Ct
- 1348 Bent Tree Ln