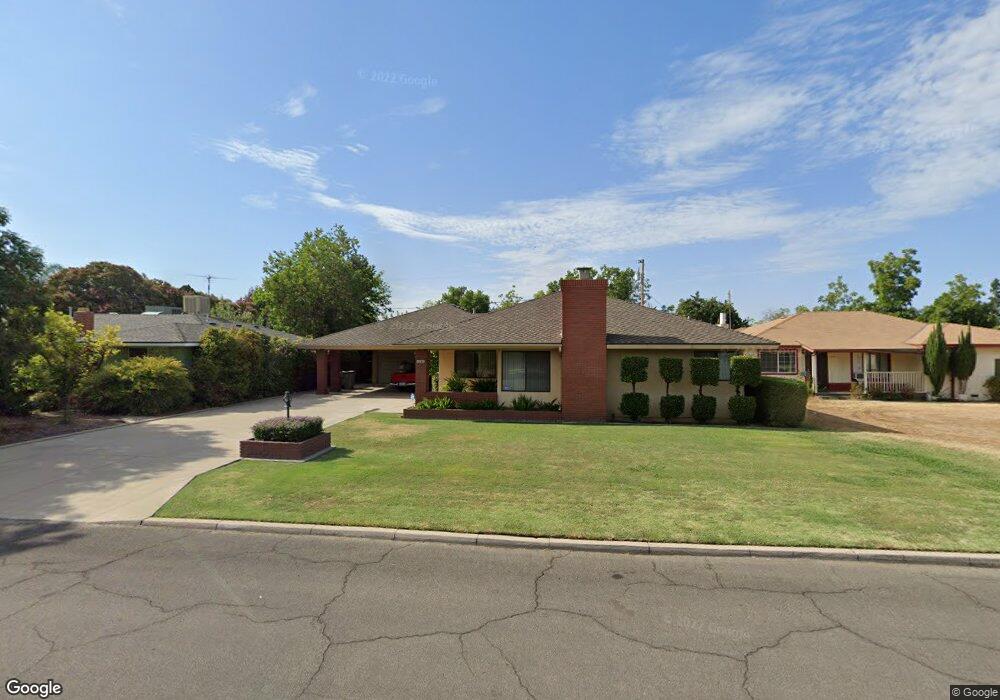
4396 E Simpson Ave Fresno, CA 93703
McLane NeighborhoodEstimated Value: $301,908 - $317,000
3
Beds
2
Baths
1,377
Sq Ft
$224/Sq Ft
Est. Value
About This Home
This home is located at 4396 E Simpson Ave, Fresno, CA 93703 and is currently estimated at $308,969, approximately $224 per square foot. 4396 E Simpson Ave is a home located in Fresno County with nearby schools including Norseman Elementary School, Scandinavian Middle School, and Mclane High School.
Ownership History
Date
Name
Owned For
Owner Type
Purchase Details
Closed on
Apr 29, 2025
Sold by
Larry J Kevorkian Revocable Living Trust and Klomp Bradley Herman
Bought by
Klomp Bradley Herman
Current Estimated Value
Purchase Details
Closed on
Oct 23, 2018
Sold by
Kevorkian Larry J and Kevorkian Larry Jacob
Bought by
Kevorkian Larry J and Larry J Kevorkian Revocable Li
Purchase Details
Closed on
Oct 29, 2013
Sold by
Kevorkian Rose
Bought by
Kevorkian Larry Jacob
Purchase Details
Closed on
Jul 27, 2007
Sold by
Kevorkian Jacob and Kevorkian Rose
Bought by
Kevorkian Rose
Purchase Details
Closed on
May 7, 1996
Sold by
Kevorkian Larry Jacob
Bought by
Kevorkian Alan Keith
Purchase Details
Closed on
Sep 13, 1993
Sold by
Brown William R and Brown Debbie G
Bought by
Kevorkian Alan Keith
Create a Home Valuation Report for This Property
The Home Valuation Report is an in-depth analysis detailing your home's value as well as a comparison with similar homes in the area
Home Values in the Area
Average Home Value in this Area
Purchase History
| Date | Buyer | Sale Price | Title Company |
|---|---|---|---|
| Klomp Bradley Herman | -- | None Listed On Document | |
| Kevorkian Larry J | -- | None Available | |
| Kevorkian Larry Jacob | -- | None Available | |
| Kevorkian Rose | -- | None Available | |
| Kevorkian Rose | -- | None Available | |
| Kevorkian Alan Keith | $70,000 | North American Title Co | |
| Kevorkian Alan Keith | $55,000 | North American Title Co Inc |
Source: Public Records
Tax History
| Year | Tax Paid | Tax Assessment Tax Assessment Total Assessment is a certain percentage of the fair market value that is determined by local assessors to be the total taxable value of land and additions on the property. | Land | Improvement |
|---|---|---|---|---|
| 2025 | $1,116 | $94,011 | $11,264 | $82,747 |
| 2023 | $1,050 | $90,363 | $10,828 | $79,535 |
| 2022 | $1,034 | $88,592 | $10,616 | $77,976 |
| 2021 | $1,004 | $86,856 | $10,408 | $76,448 |
| 2020 | $999 | $85,967 | $10,302 | $75,665 |
| 2019 | $959 | $84,282 | $10,100 | $74,182 |
| 2018 | $937 | $82,630 | $9,902 | $72,728 |
| 2017 | $920 | $81,010 | $9,708 | $71,302 |
| 2016 | $888 | $79,422 | $9,518 | $69,904 |
| 2015 | $873 | $78,230 | $9,376 | $68,854 |
| 2014 | $856 | $76,699 | $9,193 | $67,506 |
Source: Public Records
Map
Nearby Homes
- 4137 E Cornell Ave
- 2746 N Cedar Ave
- 4536 E Simpson Ave
- 3938 E Michigan Ave
- 4115 E Dayton Ave
- 3945 E Cortland Ave
- 4135 E Fedora Ave
- 4023 E Fedora Ave
- 3117 N 8th St
- 4704 E Simpson Ave
- 3413 N Millbrook Ave
- 2146 N Maple Ave
- 4560 E Cambridge Ave
- 4597 E Cambridge Ave
- 4715 E Harvard Ave
- 3715 E Garland Ave
- 4052 E Farrin Ave
- 2004 N Maple Ave
- 3734 E Dakota Ave
- 2902 N 4th St
- 4404 E Simpson Ave
- 4368 E Simpson Ave
- 4414 E Simpson Ave
- 4397 E Cornell Ave
- 4405 E Cornell Ave
- 4312 E Simpson Ave
- 4415 E Cornell Ave
- 4395 E Simpson Ave
- 4424 E Simpson Ave
- 4403 E Simpson Ave
- 4381 E Simpson Ave
- 4413 E Simpson Ave
- 4367 E Simpson Ave
- 4353 E Simpson Ave
- 4425 E Cornell Ave
- 4339 E Simpson Ave
- 4325 E Simpson Ave
- 4434 E Simpson Ave
- 4423 E Simpson Ave
- 4311 E Simpson Ave
Your Personal Tour Guide
Ask me questions while you tour the home.