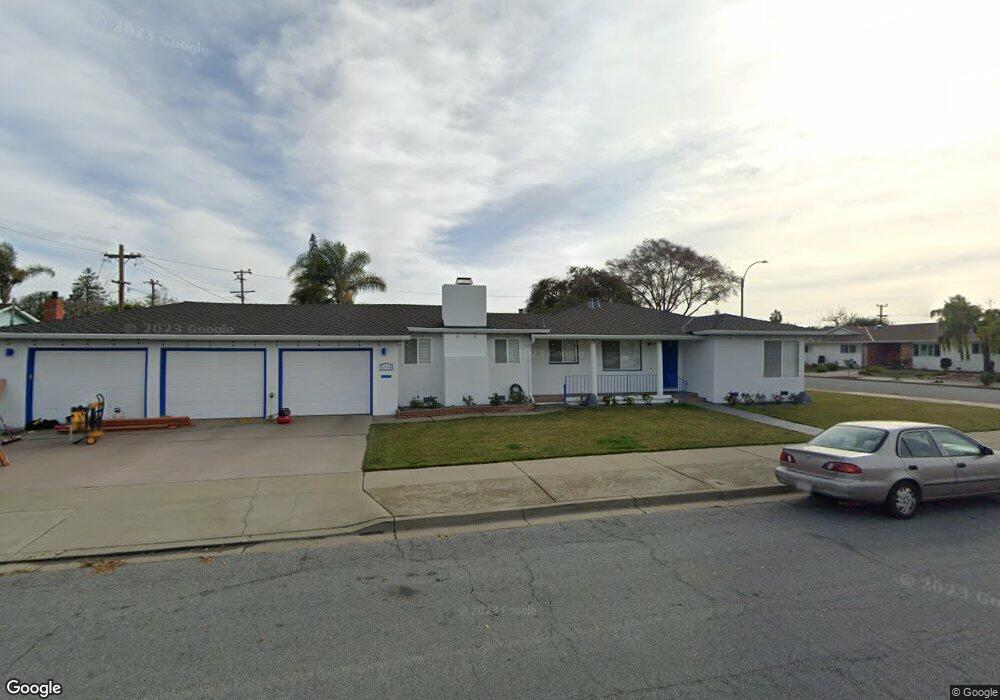
4398 Faulkner Dr Fremont, CA 94536
Glenmoor NeighborhoodEstimated Value: $1,548,000 - $1,870,000
3
Beds
2
Baths
1,513
Sq Ft
$1,124/Sq Ft
Est. Value
About This Home
This home is located at 4398 Faulkner Dr, Fremont, CA 94536 and is currently estimated at $1,700,590, approximately $1,123 per square foot. 4398 Faulkner Dr is a home located in Alameda County with nearby schools including Glenmoor Elementary School, Centerville Junior High School, and Washington High School.
Ownership History
Date
Name
Owned For
Owner Type
Purchase Details
Closed on
Jun 13, 2012
Sold by
Hatter Amber D
Bought by
Hatter Amber D and The Hatter 2007 Trust
Current Estimated Value
Home Financials for this Owner
Home Financials are based on the most recent Mortgage that was taken out on this home.
Original Mortgage
$267,000
Interest Rate
3.77%
Mortgage Type
New Conventional
Purchase Details
Closed on
Aug 23, 2007
Sold by
Hatter Amber D
Bought by
Hatter Amber D and Hatter 2007 Trust
Purchase Details
Closed on
Dec 21, 2005
Sold by
Hatter Amber D
Bought by
Hatter Amber D
Home Financials for this Owner
Home Financials are based on the most recent Mortgage that was taken out on this home.
Original Mortgage
$265,000
Interest Rate
6.36%
Mortgage Type
New Conventional
Purchase Details
Closed on
Jan 28, 2005
Sold by
Stouffer Dana M and Hatter Amber D
Bought by
Hatter Amber D
Create a Home Valuation Report for This Property
The Home Valuation Report is an in-depth analysis detailing your home's value as well as a comparison with similar homes in the area
Home Values in the Area
Average Home Value in this Area
Purchase History
| Date | Buyer | Sale Price | Title Company |
|---|---|---|---|
| Hatter Amber D | -- | Old Republic Title Company | |
| Hatter Amber D | -- | Old Republic Title Company | |
| Hatter Amber D | -- | None Available | |
| Hatter Amber D | -- | Ticor Title Company Of Ca | |
| Hatter Amber D | -- | -- |
Source: Public Records
Mortgage History
| Date | Status | Borrower | Loan Amount |
|---|---|---|---|
| Closed | Hatter Amber D | $267,000 | |
| Closed | Hatter Amber D | $265,000 |
Source: Public Records
Tax History Compared to Growth
Tax History
| Year | Tax Paid | Tax Assessment Tax Assessment Total Assessment is a certain percentage of the fair market value that is determined by local assessors to be the total taxable value of land and additions on the property. | Land | Improvement |
|---|---|---|---|---|
| 2025 | $3,549 | $245,759 | $67,126 | $185,633 |
| 2024 | $3,549 | $240,803 | $65,810 | $181,993 |
| 2023 | $3,437 | $242,945 | $64,520 | $178,425 |
| 2022 | $3,369 | $231,182 | $63,255 | $174,927 |
| 2021 | $3,292 | $226,511 | $62,014 | $171,497 |
| 2020 | $3,226 | $231,119 | $61,379 | $169,740 |
| 2019 | $3,192 | $226,587 | $60,175 | $166,412 |
| 2018 | $3,126 | $222,145 | $58,996 | $163,149 |
| 2017 | $3,047 | $217,790 | $57,839 | $159,951 |
| 2016 | $2,983 | $213,520 | $56,705 | $156,815 |
| 2015 | $2,931 | $210,314 | $55,854 | $154,460 |
| 2014 | $2,871 | $206,195 | $54,760 | $151,435 |
Source: Public Records
Map
Nearby Homes
- 38265 Corrigan Ct
- 4586 Norris Rd
- 37621 Glenmoor Dr
- Plan 1629 at Veranda
- Plan 1165 at Veranda
- Plan 1670 at Veranda
- Plan 1455 at Veranda
- Plan 1394 at Veranda
- Plan 1725 at Veranda
- Plan 1378 at Veranda
- Plan 1657 at Veranda
- 4328 Cognina Ct
- 3810 Burton Common
- 3833 Burton Common
- 37721 Madera Ct
- 4737 Deadwood Dr
- 4715 Eggers Dr
- 38030 Dundee Common
- 4237 Garland Dr
- 37637 Canterbury St
- 37846 Ralco Rd
- 4384 Faulkner Dr
- 37862 Ralco Rd
- 4365 Faulkner Dr
- 4373 Faulkner Dr
- 37835 Ralco Rd
- 4357 Faulkner Dr
- 4370 Faulkner Dr
- 4405 Faulkner Dr
- 4359 Lombard Ave
- 4371 Lombard Ave
- 4349 Faulkner Dr
- 4413 Faulkner Dr
- 37853 Ralco Rd
- 4347 Lombard Ave
- 4356 Faulkner Dr
- 4420 Faulkner Dr
- 4341 Faulkner Dr
- 37824 Menard Ct
- 4421 Faulkner Dr