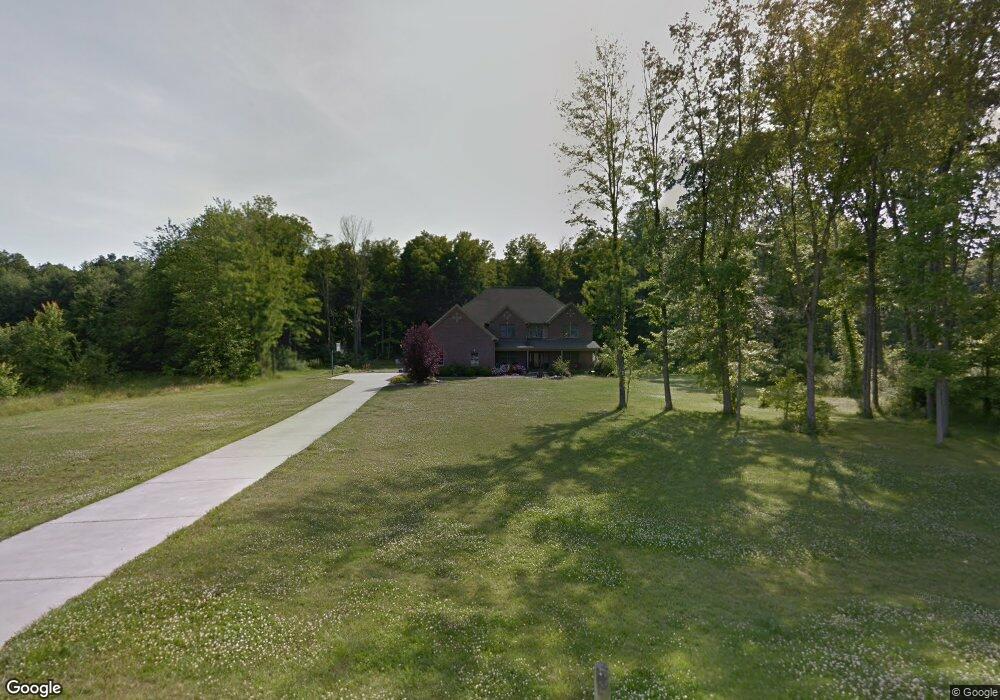
4399 Morrow Meadow Dr Morrow, OH 45152
Estimated Value: $783,000 - $835,000
5
Beds
4
Baths
3,847
Sq Ft
$209/Sq Ft
Est. Value
About This Home
This home is located at 4399 Morrow Meadow Dr, Morrow, OH 45152 and is currently estimated at $803,471, approximately $208 per square foot. 4399 Morrow Meadow Dr is a home located in Warren County with nearby schools including Little Miami Early Childhood Center, Little Miami Intermediate Middle School, and Little Miami Middle School.
Ownership History
Date
Name
Owned For
Owner Type
Purchase Details
Closed on
Sep 26, 2005
Sold by
Martinelli Robert and Martinelli Pamela
Bought by
Carpenter Paul E and Carpenter Kimberly J
Current Estimated Value
Home Financials for this Owner
Home Financials are based on the most recent Mortgage that was taken out on this home.
Original Mortgage
$359,650
Outstanding Balance
$187,283
Interest Rate
5.82%
Mortgage Type
Fannie Mae Freddie Mac
Estimated Equity
$616,188
Purchase Details
Closed on
Dec 22, 2003
Sold by
Gude Alfredo A
Bought by
Martinelli Robert and Martinelli Pamela
Purchase Details
Closed on
Mar 21, 2002
Sold by
Kirschner Gary
Bought by
Gude Alfredo A
Home Financials for this Owner
Home Financials are based on the most recent Mortgage that was taken out on this home.
Original Mortgage
$63,750
Interest Rate
6.95%
Mortgage Type
New Conventional
Purchase Details
Closed on
Aug 25, 2000
Sold by
Morrow Lakes Ltd
Bought by
Kirschner Gary B and Kirschner Evelyn
Create a Home Valuation Report for This Property
The Home Valuation Report is an in-depth analysis detailing your home's value as well as a comparison with similar homes in the area
Home Values in the Area
Average Home Value in this Area
Purchase History
We collect this data history from publicly available records. To have your information removed, we recommend requesting removal directly through your county’s website.
| Date | Buyer | Sale Price | Title Company |
|---|---|---|---|
| Carpenter Paul E | $407,000 | Custom Land Title Llc | |
| Martinelli Robert | $76,900 | Technic Title | |
| Gude Alfredo A | $75,000 | -- | |
| Kirschner Gary B | $67,450 | -- |
Source: Public Records
Mortgage History
We collect this data history from publicly available records. To have your information removed, we recommend requesting removal directly through your county’s website.
| Date | Status | Borrower | Loan Amount |
|---|---|---|---|
| Open | Carpenter Paul E | $359,650 | |
| Previous Owner | Gude Alfredo A | $63,750 |
Source: Public Records
Tax History
| Year | Tax Paid | Tax Assessment Tax Assessment Total Assessment is a certain percentage of the fair market value that is determined by local assessors to be the total taxable value of land and additions on the property. | Land | Improvement |
|---|---|---|---|---|
| 2025 | $8,980 | $196,470 | $43,160 | $153,310 |
| 2024 | $8,980 | $197,290 | $43,160 | $154,130 |
| 2023 | $8,370 | $163,975 | $27,576 | $136,398 |
| 2022 | $8,270 | $163,975 | $27,577 | $136,399 |
| 2021 | $7,901 | $163,975 | $27,577 | $136,399 |
| 2020 | $7,554 | $133,315 | $22,421 | $110,894 |
| 2019 | $7,683 | $133,315 | $22,421 | $110,894 |
| 2018 | $7,751 | $133,315 | $22,421 | $110,894 |
| 2017 | $6,944 | $116,109 | $18,662 | $97,447 |
| 2016 | $7,087 | $116,109 | $18,662 | $97,447 |
| 2015 | $6,646 | $116,109 | $18,662 | $97,447 |
| 2014 | $7,094 | $112,120 | $18,320 | $93,790 |
| 2013 | $6,976 | $137,170 | $21,020 | $116,150 |
Source: Public Records
Map
Nearby Homes
- 7577 Misty Woods Ct
- 4622 Misty Ridge Ct
- 6017 Outlook Ct
- 5750 Azra Ct
- 7426 Gheils Carroll Rd
- 6590 Morrow Rossburg Rd
- 7152 Gheils Carroll Rd
- 4701 Todds Fork Dr
- 4715 Todds Fork Dr
- 6521 Morrow Rossburg Rd
- Lot A Ludlum Rd
- 4910 Allens Ridge Dr
- 8497 Debold Koebel Rd
- 4648 Kenneth Joseph Ct
- 5730 Jo Anne Rose Ct
- 5752 Tonya Marie Ct
- 4769 Jessica Suzanne Dr
- 5815 Josie’s Cove
- 3163 Rosemary Ct
- 3184 Sage Ct
- 4399 Morrow Meadow Dr Unit 40
- 4363 Morrow Meadow Dr
- 4467 Morrow Meadow Dr
- 7202 Misty Meadow Ln
- 4321 Morrow Meadow Dr
- 4442 Morrow Meadow Dr
- 7337 Orchard View Ln
- 7205 Misty Meadow Ln
- 7150 Misty Meadow Ln Unit 13
- 7150 Misty Meadow Ln
- 4276 Morrow Meadow Dr
- 7281 Orchard View Ln
- 0 Misty Meadows Ct Unit 21 1224031
- 0 Misty Meadows Ct Unit 5 1224037
- 0 Misty Meadows Ct Unit 7 1224043
- 0 Misty Meadows Ct Unit 1 1224034
- 0 Misty Meadows Ct Unit 3 1224038
- 0 Misty Meadows Ct Unit 19 1228042
- 0 Misty Meadows Ct Unit 7 1243431
- 0 Misty Meadows Ct Unit 3 1243428
Your Personal Tour Guide
Ask me questions while you tour the home.