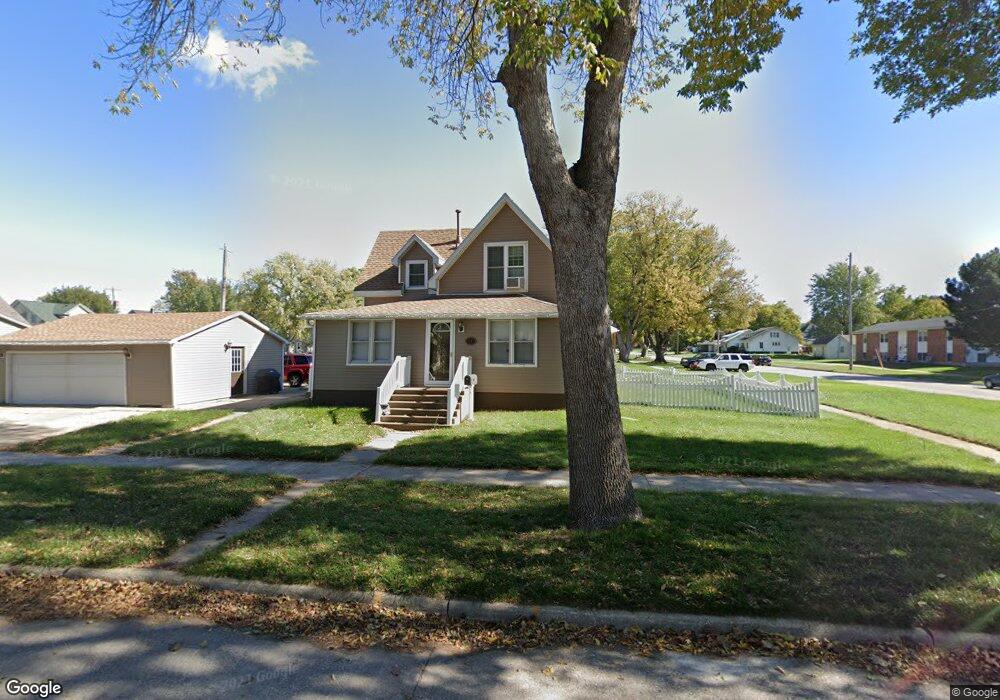
44 4th Ave SE Unit 3F Le Mars, IA 51031
Estimated Value: $151,245 - $188,000
1
Bed
1
Bath
1,165
Sq Ft
$144/Sq Ft
Est. Value
About This Home
This home is located at 44 4th Ave SE Unit 3F, Le Mars, IA 51031 and is currently estimated at $168,311, approximately $144 per square foot. 44 4th Ave SE Unit 3F is a home located in Plymouth County with nearby schools including Le Mars High School, Gehlen Catholic Schools, and Gehlen Elementary School.
Ownership History
Date
Name
Owned For
Owner Type
Purchase Details
Closed on
Jun 21, 2013
Sold by
Helmrichs Christopher L and Helmrichs Laura I
Bought by
Frerichs Mark R and Frerichs Shari L
Current Estimated Value
Home Financials for this Owner
Home Financials are based on the most recent Mortgage that was taken out on this home.
Original Mortgage
$76,500
Outstanding Balance
$54,087
Interest Rate
3.43%
Mortgage Type
New Conventional
Estimated Equity
$114,224
Purchase Details
Closed on
Jun 1, 2006
Sold by
Frerichs Mark R and Frerichs Shari L
Bought by
Helmrichs Christopher I and Helmrichs Laura L
Home Financials for this Owner
Home Financials are based on the most recent Mortgage that was taken out on this home.
Original Mortgage
$80,000
Interest Rate
6.62%
Mortgage Type
New Conventional
Create a Home Valuation Report for This Property
The Home Valuation Report is an in-depth analysis detailing your home's value as well as a comparison with similar homes in the area
Home Values in the Area
Average Home Value in this Area
Purchase History
| Date | Buyer | Sale Price | Title Company |
|---|---|---|---|
| Frerichs Mark R | $90,000 | None Available | |
| Helmrichs Christopher I | $80,000 | None Available |
Source: Public Records
Mortgage History
| Date | Status | Borrower | Loan Amount |
|---|---|---|---|
| Open | Frerichs Mark R | $76,500 | |
| Previous Owner | Helmrichs Christopher I | $80,000 |
Source: Public Records
Tax History Compared to Growth
Tax History
| Year | Tax Paid | Tax Assessment Tax Assessment Total Assessment is a certain percentage of the fair market value that is determined by local assessors to be the total taxable value of land and additions on the property. | Land | Improvement |
|---|---|---|---|---|
| 2025 | $1,688 | $136,970 | $19,040 | $117,930 |
| 2024 | $1,574 | $124,050 | $19,040 | $105,010 |
| 2023 | $1,484 | $123,090 | $9,520 | $113,570 |
| 2022 | $1,470 | $100,340 | $9,520 | $90,820 |
| 2021 | $1,440 | $100,340 | $9,520 | $90,820 |
| 2020 | $1,440 | $93,550 | $9,520 | $84,030 |
| 2019 | -- | $93,550 | $9,520 | $84,030 |
| 2018 | -- | $86,490 | $9,520 | $76,970 |
| 2017 | -- | $84,140 | $0 | $0 |
| 2016 | -- | $84,140 | $0 | $0 |
| 2015 | -- | $77,410 | $0 | $0 |
| 2014 | -- | $0 | $0 | $0 |
Source: Public Records
Map
Nearby Homes
- 10 7th Ave SE
- 321 2nd Ave SE
- 401 Central Ave SW
- TBD Park Village
- 15 Park Village
- 520 Central Ave SE
- 1121 2nd St SE
- 729 7th Ave SE
- 307 9th St SE
- 212 6th St SW
- 582 Penny Ln
- 418 3rd St NW
- 35 9th St SW
- TBD 9th St SW
- 125 9th St SW
- 123 10th St SW
- 626 3rd St SW
- 539 14th St SW
- 811 3rd St SE
- LOT 9 Northern Heights