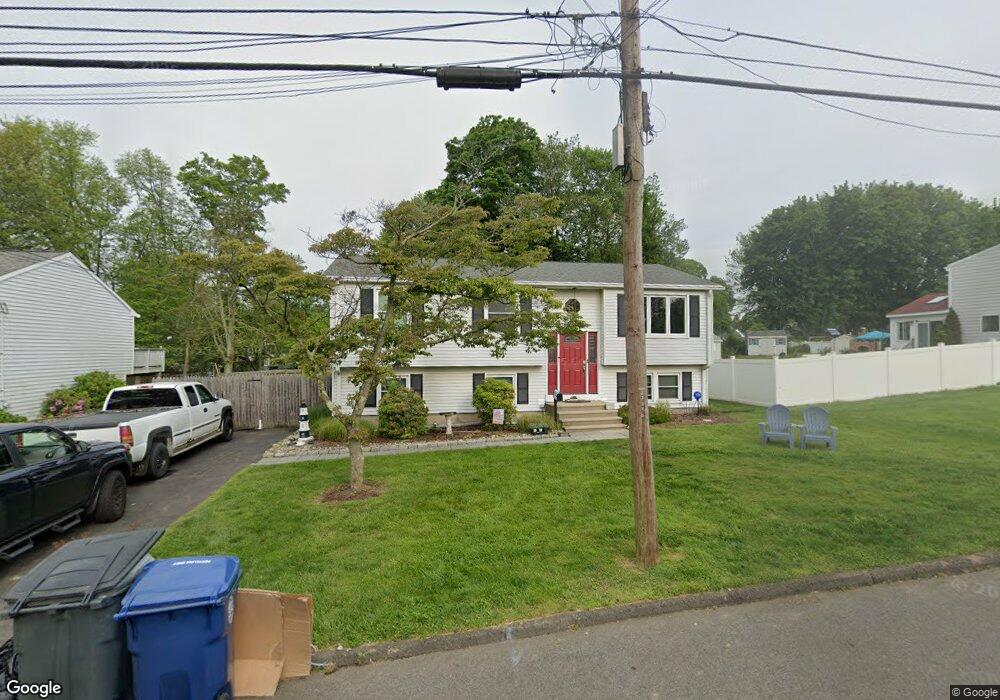
44 Annawon Ave West Haven, CT 06516
West Shore NeighborhoodEstimated Value: $283,000 - $436,327
3
Beds
2
Baths
1,074
Sq Ft
$349/Sq Ft
Est. Value
About This Home
This home is located at 44 Annawon Ave, West Haven, CT 06516 and is currently estimated at $375,082, approximately $349 per square foot. 44 Annawon Ave is a home located in New Haven County with nearby schools including Carrigan 5/6 Intermediate School, Harry M. Bailey Middle School, and West Haven High School.
Ownership History
Date
Name
Owned For
Owner Type
Purchase Details
Closed on
Dec 22, 2021
Sold by
Camara Nicolle
Bought by
Vigneron Nicolle and Vigneron Annette
Current Estimated Value
Home Financials for this Owner
Home Financials are based on the most recent Mortgage that was taken out on this home.
Original Mortgage
$205,000
Outstanding Balance
$160,280
Interest Rate
2.34%
Mortgage Type
Stand Alone Refi Refinance Of Original Loan
Estimated Equity
$214,802
Purchase Details
Closed on
May 12, 2015
Sold by
Freddie Mac
Bought by
Flippin Nutz Llc
Purchase Details
Closed on
Aug 1, 2014
Sold by
Owens Shirley O
Bought by
Nutz Llc Flippen
Purchase Details
Closed on
Jan 22, 2010
Sold by
Mclellan Lorelie Est and Mclellan
Bought by
Camara Nicolle
Create a Home Valuation Report for This Property
The Home Valuation Report is an in-depth analysis detailing your home's value as well as a comparison with similar homes in the area
Home Values in the Area
Average Home Value in this Area
Purchase History
| Date | Buyer | Sale Price | Title Company |
|---|---|---|---|
| Vigneron Nicolle | -- | None Available | |
| Vigneron Nicolle | -- | None Available | |
| Flippin Nutz Llc | $123,375 | -- | |
| Nutz Llc Flippen | $122,500 | -- | |
| Camara Nicolle | -- | -- | |
| Camara Nicolle | -- | -- | |
| Camara Nicolle | -- | -- | |
| Camara Nicolle | -- | -- | |
| Flippin Nutz Llc | $123,375 | -- | |
| Nutz Llc Flippen | $122,500 | -- | |
| Camara Nicolle | -- | -- |
Source: Public Records
Mortgage History
| Date | Status | Borrower | Loan Amount |
|---|---|---|---|
| Open | Vigneron Nicolle | $205,000 | |
| Closed | Vigneron Nicolle | $205,000 | |
| Previous Owner | Camara Nicolle | $168,000 |
Source: Public Records
Tax History Compared to Growth
Tax History
| Year | Tax Paid | Tax Assessment Tax Assessment Total Assessment is a certain percentage of the fair market value that is determined by local assessors to be the total taxable value of land and additions on the property. | Land | Improvement |
|---|---|---|---|---|
| 2025 | $8,223 | $250,180 | $96,600 | $153,580 |
| 2024 | $7,423 | $158,410 | $66,920 | $91,490 |
| 2023 | $7,144 | $158,410 | $66,920 | $91,490 |
| 2022 | $7,016 | $158,410 | $66,920 | $91,490 |
| 2021 | $7,016 | $158,410 | $66,920 | $91,490 |
| 2020 | $7,043 | $144,900 | $61,740 | $83,160 |
| 2019 | $6,819 | $144,900 | $61,740 | $83,160 |
| 2018 | $6,722 | $144,900 | $61,740 | $83,160 |
| 2017 | $6,541 | $144,900 | $61,740 | $83,160 |
| 2016 | $6,468 | $144,900 | $61,740 | $83,160 |
| 2015 | $6,398 | $160,440 | $68,810 | $91,630 |
| 2014 | -- | $160,440 | $68,810 | $91,630 |
Source: Public Records
Map
Nearby Homes