44 Black Walnut Ln Jim Thorpe, PA 18229
Estimated Value: $137,011 - $307,000
2
Beds
1
Bath
768
Sq Ft
$290/Sq Ft
Est. Value
About This Home
This home is located at 44 Black Walnut Ln, Jim Thorpe, PA 18229 and is currently estimated at $223,004, approximately $290 per square foot. 44 Black Walnut Ln is a home with nearby schools including Jim Thorpe Area High School.
Ownership History
Date
Name
Owned For
Owner Type
Purchase Details
Closed on
Dec 1, 2020
Sold by
Duggan Patrick O and Duggan Bridget A
Bought by
Duggan Patrick O and Davies Patricia B
Current Estimated Value
Create a Home Valuation Report for This Property
The Home Valuation Report is an in-depth analysis detailing your home's value as well as a comparison with similar homes in the area
Home Values in the Area
Average Home Value in this Area
Purchase History
| Date | Buyer | Sale Price | Title Company |
|---|---|---|---|
| Duggan Patrick O | -- | None Available |
Source: Public Records
Tax History Compared to Growth
Tax History
| Year | Tax Paid | Tax Assessment Tax Assessment Total Assessment is a certain percentage of the fair market value that is determined by local assessors to be the total taxable value of land and additions on the property. | Land | Improvement |
|---|---|---|---|---|
| 2025 | $1,301 | $21,150 | $4,800 | $16,350 |
| 2024 | $1,238 | $21,150 | $4,800 | $16,350 |
| 2023 | $1,222 | $21,150 | $4,800 | $16,350 |
| 2022 | $1,153 | $19,950 | $4,800 | $15,150 |
| 2021 | $1,153 | $19,950 | $4,800 | $15,150 |
| 2020 | $1,153 | $19,950 | $4,800 | $15,150 |
| 2019 | $1,113 | $19,950 | $4,800 | $15,150 |
| 2018 | $1,113 | $19,950 | $4,800 | $15,150 |
| 2017 | $1,113 | $19,950 | $4,800 | $15,150 |
| 2016 | -- | $19,950 | $4,800 | $15,150 |
| 2015 | -- | $19,950 | $4,800 | $15,150 |
| 2014 | -- | $19,950 | $4,800 | $15,150 |
Source: Public Records
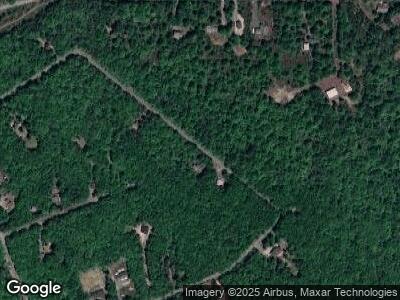
Map
Nearby Homes
- 643 Stony Mountain Rd
- EV1151 Way
- 22 Petrarch Trail
- 30 MacCauley Rd
- 112 Aspen Dr
- EV1440 Gasse Glen
- 59 Caedman Dr
- EV1257 Chapman Cir
- 112 Lipo Way
- A375 Locust Dr
- 53 MacCauley Rd
- 61 Chapman Cir
- Lot 29 & 30 Stony Mountain Rd
- Lot 29 & 3 Stony Mountain Rd
- 120 Lipo Way
- EV1384 Stony Mountain Rd
- Lot 1007 Stony Mountain Rd
- lot EV1395 Stony Mountain Rd
- A264 Stony Mountain Rd
- 0 Parker Trail & Dickens Way Unit PM-121697
- 44 Black Walnut Ln
- 44 LOT#A216 Black Walnut Ln
- 38 Black Walnut Ln
- Lot A214 Walnut Ln
- A210 Walnut Ln
- 211 Black Walnut Ln
- A218 Chestnut Ln
- 150 150 Black Walnut Ln
- 150 Black Walnut Ln
- LOT#A216 Black Walnut Ln
- A150 Black Walnut Ln
- 150 Black Walnut Ln
- A213 Black Walnut Ln
- A212 Black Walnut Ln
- A145 Black Walnut Ln
- 114 Chestnut Ln
- 93 Chestnut Ln
- 231 Blue Spruce Ln
- A156 Chestnut Ln
- 22 Black Walnut Ln