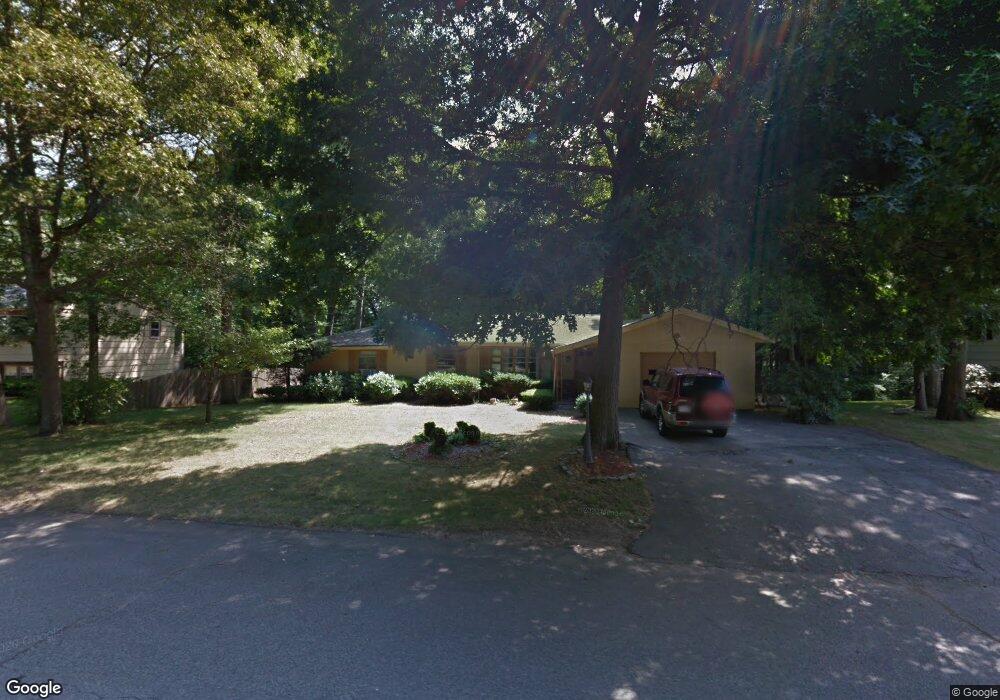
44 Brian Dr Brockton, MA 02301
Estimated Value: $567,237 - $603,000
3
Beds
3
Baths
1,610
Sq Ft
$364/Sq Ft
Est. Value
About This Home
This home is located at 44 Brian Dr, Brockton, MA 02301 and is currently estimated at $586,059, approximately $364 per square foot. 44 Brian Dr is a home located in Plymouth County with nearby schools including Hancock Elementary School, Manthala George Jr. School, and Louis F Angelo Elementary School.
Ownership History
Date
Name
Owned For
Owner Type
Purchase Details
Closed on
Dec 9, 2005
Sold by
44 Brian Dr Rt
Bought by
Colon Sandra B
Current Estimated Value
Home Financials for this Owner
Home Financials are based on the most recent Mortgage that was taken out on this home.
Original Mortgage
$233,600
Interest Rate
6.17%
Mortgage Type
Purchase Money Mortgage
Create a Home Valuation Report for This Property
The Home Valuation Report is an in-depth analysis detailing your home's value as well as a comparison with similar homes in the area
Purchase History
| Date | Buyer | Sale Price | Title Company |
|---|---|---|---|
| Colon Sandra B | $292,000 | -- |
Source: Public Records
Mortgage History
| Date | Status | Borrower | Loan Amount |
|---|---|---|---|
| Open | Colon Sandra B | $320,000 | |
| Closed | Colon Sandra B | $15,000 | |
| Closed | Colon Sandra B | $233,600 | |
| Closed | Colon Sandra B | $58,400 |
Source: Public Records
Tax History
| Year | Tax Paid | Tax Assessment Tax Assessment Total Assessment is a certain percentage of the fair market value that is determined by local assessors to be the total taxable value of land and additions on the property. | Land | Improvement |
|---|---|---|---|---|
| 2025 | $5,733 | $473,400 | $151,000 | $322,400 |
| 2024 | $5,558 | $462,400 | $151,000 | $311,400 |
| 2023 | $4,941 | $380,700 | $116,400 | $264,300 |
| 2022 | $5,295 | $379,000 | $106,000 | $273,000 |
| 2021 | $4,929 | $339,900 | $98,800 | $241,100 |
| 2020 | $4 | $309,400 | $94,600 | $214,800 |
| 2019 | $4,320 | $278,000 | $88,600 | $189,400 |
| 2018 | $4,119 | $256,500 | $88,600 | $167,900 |
| 2017 | $5,178 | $228,600 | $88,600 | $140,000 |
| 2016 | $3,870 | $222,900 | $84,800 | $138,100 |
| 2015 | $3,900 | $214,900 | $84,800 | $130,100 |
| 2014 | $3,782 | $208,600 | $84,800 | $123,800 |
Source: Public Records
Map
Nearby Homes
- 18 Edinboro Ave
- 130 Braemoor Rd
- 32 Hampden Ave
- 31 Magnolia Ave
- 18 Sagamore Rd
- 74 Linwood St
- 155 Rockland Dr
- 197 Candy Ln
- 18 Belmont Place
- 81 Hancock Ave
- 28 Frost Ave
- 596 Ash St
- 12 Frost Ave
- 47 N Belcher Ave
- 990 Pleasant St
- 23 Arborway
- 16 Falconer Ave
- 433 W Elm St Unit 2
- 425 W Elm St Unit 7
- 193 Boylston St
Your Personal Tour Guide
Ask me questions while you tour the home.