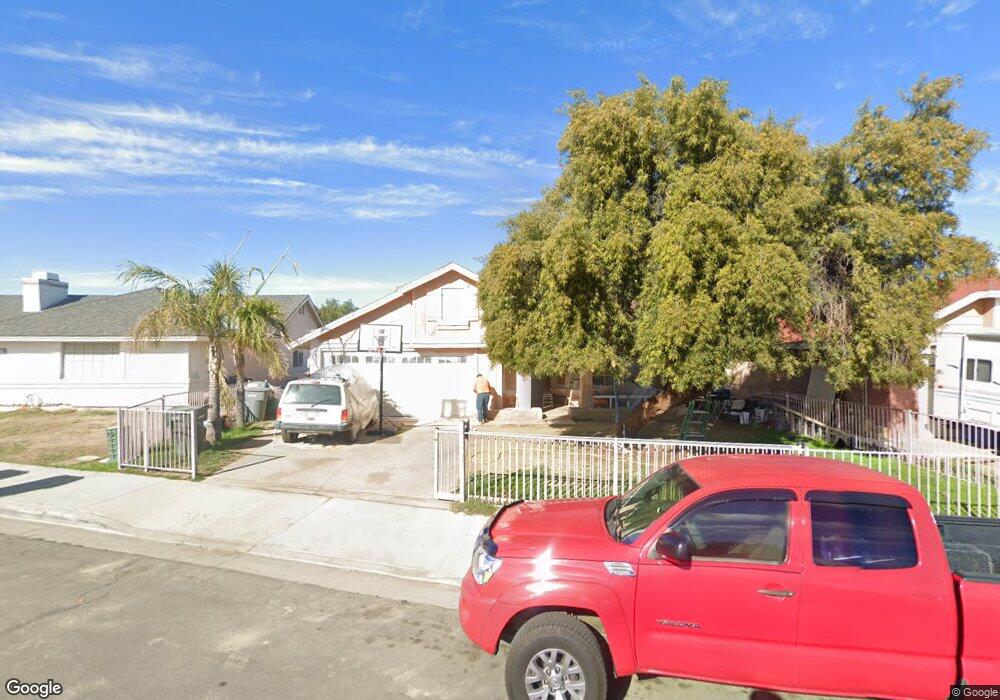
44 Brokers Tip Ct Perris, CA 92571
Central Perris NeighborhoodEstimated Value: $412,472 - $450,000
2
Beds
1
Bath
932
Sq Ft
$461/Sq Ft
Est. Value
About This Home
This home is located at 44 Brokers Tip Ct, Perris, CA 92571 and is currently estimated at $429,618, approximately $460 per square foot. 44 Brokers Tip Ct is a home located in Riverside County with nearby schools including Val Verde Elementary School, Lakeside Middle School, and Rancho Verde High School.
Ownership History
Date
Name
Owned For
Owner Type
Purchase Details
Closed on
Sep 12, 2025
Sold by
Kebe Henrietta
Bought by
Kebe Revocable Living Trust and Kebe
Current Estimated Value
Purchase Details
Closed on
Apr 13, 2000
Sold by
American Mtg Company
Bought by
Kebe Henrietta
Home Financials for this Owner
Home Financials are based on the most recent Mortgage that was taken out on this home.
Original Mortgage
$69,356
Interest Rate
8.22%
Mortgage Type
FHA
Purchase Details
Closed on
Jan 31, 2000
Sold by
Sec Va
Bought by
North American Mtg Company
Purchase Details
Closed on
Dec 2, 1999
Sold by
Sec Va
Bought by
North American Mtg Company
Purchase Details
Closed on
Aug 6, 1999
Sold by
North American Mtg Company
Bought by
Va
Purchase Details
Closed on
Jul 1, 1999
Sold by
Phillips Calvin G and La Tricia D
Bought by
Imco Realty Services Inc
Purchase Details
Closed on
May 22, 1995
Sold by
Phillips La Tricia D
Bought by
Phillips Calvin G
Create a Home Valuation Report for This Property
The Home Valuation Report is an in-depth analysis detailing your home's value as well as a comparison with similar homes in the area
Home Values in the Area
Average Home Value in this Area
Purchase History
| Date | Buyer | Sale Price | Title Company |
|---|---|---|---|
| Kebe Revocable Living Trust | -- | None Listed On Document | |
| Kebe Henrietta | $70,000 | Ati Title Company | |
| North American Mtg Company | -- | United Title Company | |
| North American Mtg Company | -- | -- | |
| Va | -- | United Title Company | |
| Imco Realty Services Inc | $48,384 | United Title Company | |
| Phillips Calvin G | -- | -- |
Source: Public Records
Mortgage History
| Date | Status | Borrower | Loan Amount |
|---|---|---|---|
| Previous Owner | Kebe Henrietta | $69,356 |
Source: Public Records
Tax History
| Year | Tax Paid | Tax Assessment Tax Assessment Total Assessment is a certain percentage of the fair market value that is determined by local assessors to be the total taxable value of land and additions on the property. | Land | Improvement |
|---|---|---|---|---|
| 2025 | $1,422 | $108,063 | $38,406 | $69,657 |
| 2024 | $1,422 | $105,945 | $37,653 | $68,292 |
| 2023 | $1,409 | $103,868 | $36,915 | $66,953 |
| 2022 | $1,384 | $101,833 | $36,192 | $65,641 |
| 2021 | $1,376 | $99,837 | $35,483 | $64,354 |
| 2020 | $1,364 | $98,815 | $35,120 | $63,695 |
| 2019 | $1,294 | $96,879 | $34,432 | $62,447 |
| 2018 | $1,279 | $94,980 | $33,757 | $61,223 |
| 2017 | $2,044 | $93,119 | $33,096 | $60,023 |
| 2016 | $2,103 | $91,295 | $32,448 | $58,847 |
| 2015 | $2,089 | $89,925 | $31,961 | $57,964 |
| 2014 | $2,122 | $88,166 | $31,336 | $56,830 |
Source: Public Records
Map
Nearby Homes
- 49 Bold Venture St
- 166 Ambrosia Ct
- 2536 Slew of Gold Ct
- 2269 Firebrand Ave
- 2231 Flash Ct
- 2248 Ridge Ct
- 450 Lisbon St
- 377 Aurora Dr
- 1900 Summertree Dr
- 466 Granite View Dr
- 129 Olivetree Dr
- 1829 Springtree Dr
- 507 Coudures Way
- 560 Coudures Way
- 716 Periwinkle Ln
- 3123 El Rosario Dr
- 3107 Lake View Dr
- 723 Anthirium Ave
- 2070 Dayflower Ct
- 1777 Amethyst Dr
- 52 Brokers Tip Ct
- 36 Brokers Tip Ct
- 45 Bold Forbes Ct
- 60 Brokers Tip Ct
- 53 Bold Forbes Ct
- 37 Bold Forbes Ct
- 26 Brokers Tip Ct
- 61 Bold Forbes Ct
- 43 Brokers Tip Ct
- 68 Brokers Tip Ct
- 51 Brokers Tip Ct
- 28 Brokers Tip Ct
- 29 Bold Forbes Ct
- 35 Brokers Tip Ct
- 69 Bold Forbes Ct
- 59 Brokers Tip Ct
- 76 Brokers Tip Ct
- 27 Brokers Tip Ct
- 67 Brokers Tip Ct
- 2510 Azra Ct
Your Personal Tour Guide
Ask me questions while you tour the home.