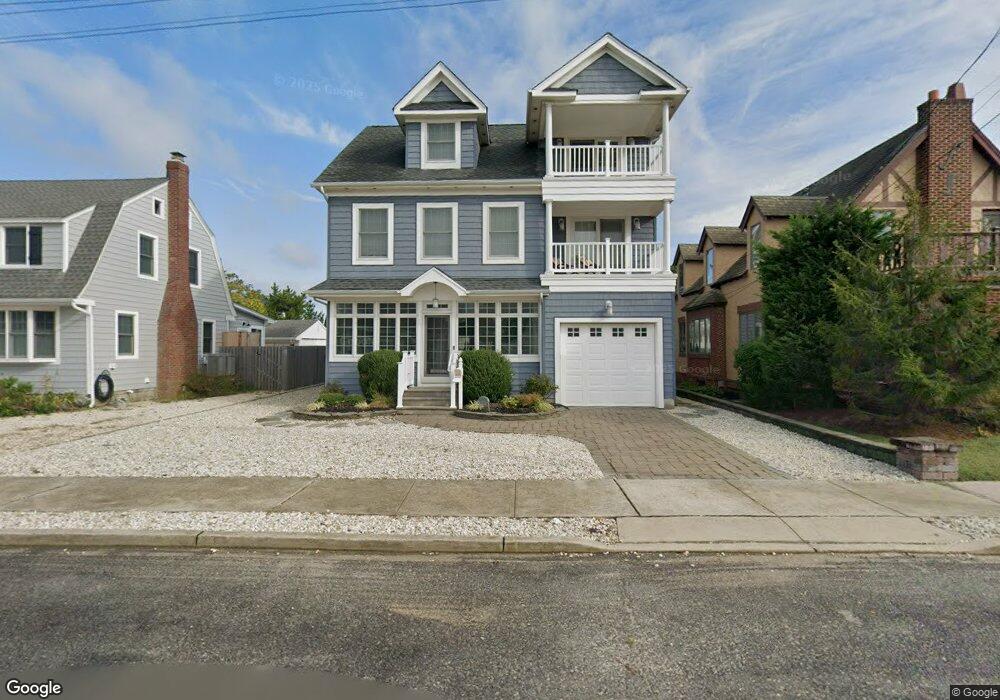
44 C St Unit 46 Seaside Park, NJ 08752
Estimated Value: $1,432,974 - $2,162,000
4
Beds
3
Baths
3,001
Sq Ft
$595/Sq Ft
Est. Value
About This Home
This home is located at 44 C St Unit 46, Seaside Park, NJ 08752 and is currently estimated at $1,784,744, approximately $594 per square foot. 44 C St Unit 46 is a home located in Ocean County with nearby schools including Central Regional Middle School and Central Regional High School.
Ownership History
Date
Name
Owned For
Owner Type
Purchase Details
Closed on
Mar 24, 2021
Sold by
Micale Mary Romano
Bought by
Micale Philip Louis
Current Estimated Value
Purchase Details
Closed on
Dec 6, 2007
Sold by
Romano Micale Md Philip Louis and Romano Micale Mary
Bought by
Micale Mary Romano
Purchase Details
Closed on
Jul 13, 2006
Sold by
Micale Edith Tortora
Bought by
Romano Micale Md Philip Louis and Romano Micale Mary
Purchase Details
Closed on
Jun 12, 2006
Sold by
Micale Edith Tortora and Estate Of Edith Tortora
Bought by
Micale Edith Tortora
Create a Home Valuation Report for This Property
The Home Valuation Report is an in-depth analysis detailing your home's value as well as a comparison with similar homes in the area
Home Values in the Area
Average Home Value in this Area
Purchase History
| Date | Buyer | Sale Price | Title Company |
|---|---|---|---|
| Micale Philip Louis | -- | None Available | |
| Micale Philip Louis | -- | None Listed On Document | |
| Micale Mary Romano | -- | None Available | |
| Romano Micale Md Philip Louis | $650,000 | None Available | |
| Micale Edith Tortora | -- | None Available |
Source: Public Records
Tax History Compared to Growth
Tax History
| Year | Tax Paid | Tax Assessment Tax Assessment Total Assessment is a certain percentage of the fair market value that is determined by local assessors to be the total taxable value of land and additions on the property. | Land | Improvement |
|---|---|---|---|---|
| 2025 | $14,611 | $893,100 | $550,000 | $343,100 |
| 2024 | $14,370 | $893,100 | $550,000 | $343,100 |
| 2023 | $13,861 | $893,100 | $550,000 | $343,100 |
| 2022 | $13,861 | $893,100 | $550,000 | $343,100 |
| 2021 | $13,566 | $893,100 | $550,000 | $343,100 |
| 2020 | $13,369 | $889,500 | $550,000 | $339,500 |
| 2019 | $13,227 | $889,500 | $550,000 | $339,500 |
| 2018 | $12,364 | $889,500 | $550,000 | $339,500 |
| 2017 | $12,551 | $889,500 | $550,000 | $339,500 |
| 2016 | $11,670 | $889,500 | $550,000 | $339,500 |
| 2015 | $12,177 | $889,500 | $550,000 | $339,500 |
| 2014 | $11,635 | $889,500 | $550,000 | $339,500 |
Source: Public Records
Map
Nearby Homes