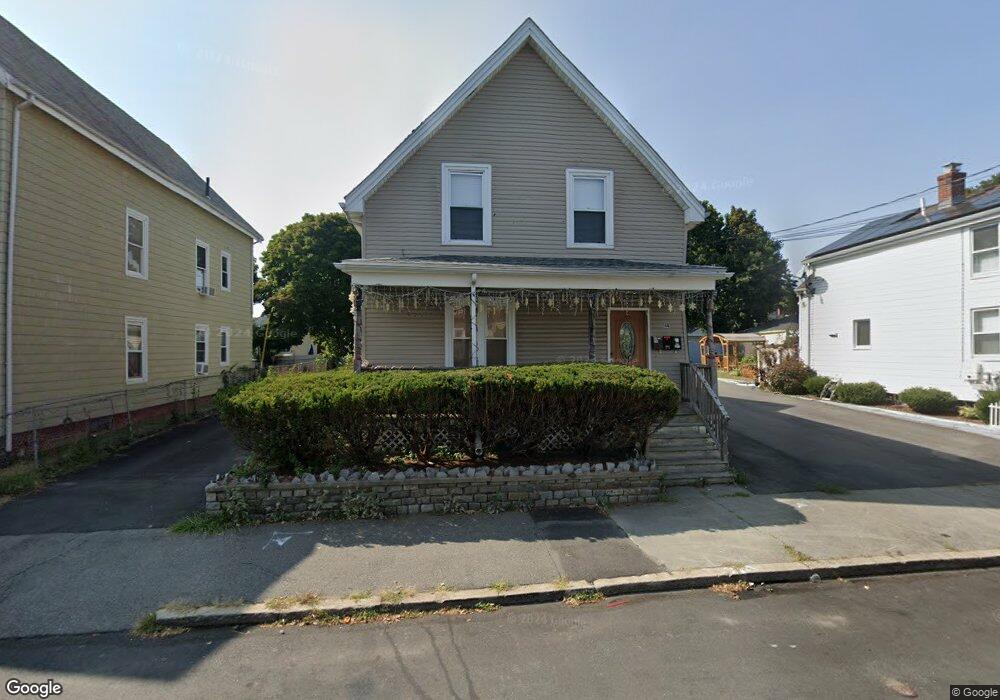
44 Cedar St Lynn, MA 01905
Pine Hill NeighborhoodEstimated Value: $693,000 - $790,000
5
Beds
3
Baths
2,503
Sq Ft
$292/Sq Ft
Est. Value
About This Home
This home is located at 44 Cedar St, Lynn, MA 01905 and is currently estimated at $730,758, approximately $291 per square foot. 44 Cedar St is a home located in Essex County with nearby schools including Tracy Elementary School, William R. Fallon School, and Fecteau-Leary Junior/Senior High School.
Ownership History
Date
Name
Owned For
Owner Type
Purchase Details
Closed on
Oct 2, 2000
Sold by
Oung Sary and Oung Chhoukrouth
Bought by
Bardales Paz and Valladares Patricia
Current Estimated Value
Purchase Details
Closed on
Sep 30, 1993
Sold by
Letourneau Fred R and Letourneau Claire
Bought by
Oung Sary and Oung Chhouk
Create a Home Valuation Report for This Property
The Home Valuation Report is an in-depth analysis detailing your home's value as well as a comparison with similar homes in the area
Home Values in the Area
Average Home Value in this Area
Purchase History
| Date | Buyer | Sale Price | Title Company |
|---|---|---|---|
| Bardales Paz | $235,000 | -- | |
| Oung Sary | $110,000 | -- |
Source: Public Records
Mortgage History
| Date | Status | Borrower | Loan Amount |
|---|---|---|---|
| Open | Oung Sary | $294,242 | |
| Closed | Oung Sary | $307,000 | |
| Closed | Oung Sary | $15,000 |
Source: Public Records
Tax History
| Year | Tax Paid | Tax Assessment Tax Assessment Total Assessment is a certain percentage of the fair market value that is determined by local assessors to be the total taxable value of land and additions on the property. | Land | Improvement |
|---|---|---|---|---|
| 2025 | $6,920 | $668,000 | $207,500 | $460,500 |
| 2024 | $6,861 | $651,600 | $195,000 | $456,600 |
| 2023 | $6,676 | $598,700 | $189,000 | $409,700 |
| 2022 | $6,747 | $542,800 | $175,000 | $367,800 |
| 2021 | $6,635 | $509,200 | $168,100 | $341,100 |
| 2020 | $6,376 | $475,800 | $148,100 | $327,700 |
| 2019 | $5,830 | $407,700 | $121,200 | $286,500 |
| 2018 | $5,454 | $360,000 | $100,800 | $259,200 |
| 2017 | $5,164 | $331,000 | $85,400 | $245,600 |
| 2016 | $4,851 | $299,800 | $76,100 | $223,700 |
| 2015 | $4,399 | $262,600 | $71,000 | $191,600 |
Source: Public Records
Map
Nearby Homes
- 34 Grove St
- 16 Salem St
- 274 Boston St
- 99 New Park St
- 50-50A Kirtland St
- 66 Harwood St
- 136 Franklin St
- 78-80 Spencer St
- 43 Baker St
- 73 Waterhill St
- 99 Franklin St
- 20 Murray St
- 70 Wyman St
- 81A Franklin St
- 121 Johnson St Unit 3L
- 28 Wyman St
- 46 Wilfred St
- 1 Hillcrest Ave
- 51 Laighton St Unit 7
- 45 Henry Ave
Your Personal Tour Guide
Ask me questions while you tour the home.