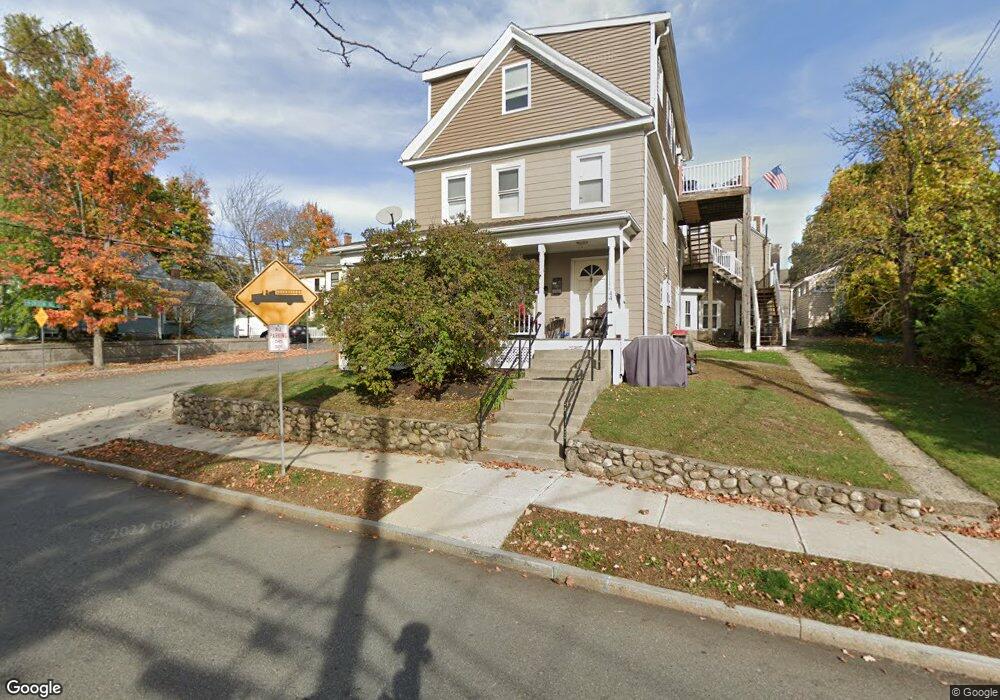
44 Crescent St Wakefield, MA 01880
Downtown Wakefield NeighborhoodEstimated Value: $988,000 - $1,092,000
6
Beds
4
Baths
3,614
Sq Ft
$288/Sq Ft
Est. Value
About This Home
This home is located at 44 Crescent St, Wakefield, MA 01880 and is currently estimated at $1,039,667, approximately $287 per square foot. 44 Crescent St is a home located in Middlesex County with nearby schools including Wakefield Memorial High School, St Joseph School, and Odyssey Day School.
Ownership History
Date
Name
Owned For
Owner Type
Purchase Details
Closed on
Oct 23, 2003
Sold by
Ditonno Janet T
Bought by
44 Crescent St Rt
Current Estimated Value
Home Financials for this Owner
Home Financials are based on the most recent Mortgage that was taken out on this home.
Original Mortgage
$340,000
Outstanding Balance
$158,011
Interest Rate
6.15%
Mortgage Type
Purchase Money Mortgage
Estimated Equity
$881,656
Create a Home Valuation Report for This Property
The Home Valuation Report is an in-depth analysis detailing your home's value as well as a comparison with similar homes in the area
Home Values in the Area
Average Home Value in this Area
Purchase History
| Date | Buyer | Sale Price | Title Company |
|---|---|---|---|
| 44 Crescent St Rt | $225,000 | -- |
Source: Public Records
Mortgage History
| Date | Status | Borrower | Loan Amount |
|---|---|---|---|
| Open | 44 Crescent St Rt | $340,000 |
Source: Public Records
Tax History
| Year | Tax Paid | Tax Assessment Tax Assessment Total Assessment is a certain percentage of the fair market value that is determined by local assessors to be the total taxable value of land and additions on the property. | Land | Improvement |
|---|---|---|---|---|
| 2025 | $9,907 | $872,900 | $348,600 | $524,300 |
| 2024 | $9,764 | $867,900 | $346,600 | $521,300 |
| 2023 | $9,284 | $791,500 | $316,100 | $475,400 |
| 2022 | $8,879 | $720,700 | $287,800 | $432,900 |
| 2021 | $8,457 | $664,300 | $268,300 | $396,000 |
| 2020 | $7,930 | $621,000 | $250,800 | $370,200 |
| 2019 | $7,576 | $590,500 | $238,500 | $352,000 |
| 2018 | $7,056 | $544,900 | $220,000 | $324,900 |
| 2017 | $6,636 | $509,300 | $205,600 | $303,700 |
| 2016 | $6,207 | $460,100 | $194,500 | $265,600 |
| 2015 | $5,796 | $430,000 | $181,800 | $248,200 |
| 2014 | $5,285 | $413,500 | $174,800 | $238,700 |
Source: Public Records
Map
Nearby Homes
- 13 Chestnut St Unit 1
- 46 Richardson St
- 175 North Ave Unit 407
- 234 Water St Unit 205
- 1 Traverse St Unit E
- 62 Foundry St Unit 310
- 62 Foundry St Unit 505
- 62 Foundry St Unit 208
- 62 Foundry St Unit 202
- 20 Lawrence St Unit 2
- 68 Preston St Unit 9D
- 11 Lawrence St
- 6 Nelly St Unit 1
- 17 Collins Rd
- 2 Savin Rd
- 293 Albion St
- 192 Salem St
- 0 Everett St
- 95 Prospect St
- 36 Pine Hill Cir
- 7777 Lincoln St
- 6 Crescent Hill
- 46 Crescent St
- 48 Crescent St
- 48 Crescent St Unit 3
- 48 Crescent St Unit 2
- 21 Lincoln St
- 21 Lincoln St Unit 3
- 21 Lincoln St Unit 1
- 5 Crescent Hill
- 8 Crescent Hill Unit 2
- 8 Crescent Hill
- 8 Crescent Hill Unit basement InLaw
- 8 Crescent Hill Unit 1
- 40 Crescent St
- 50 Crescent St
- 50 Crescent St
- 50 Crescent St Unit 2
- 50 Crescent St Unit 1
- 43 Crescent St Unit 43
Your Personal Tour Guide
Ask me questions while you tour the home.